With every webpage loaded, email sent, or video streamed, network traffic takes a complex journey…
The past few years have seen the dramatic rise of online collaborations tools such as Yammer, Slack, and now Microsoft Teams. As companies become more dependent on these tools for communication – even infrastructure dependencies with the addition of automated bots – they need to monitor the platforms to ensure they are operating well, are highly available for message consumption and dissemination and fast enough for the users that are dependent on them.
Exoprise recently released 3 new sensors that monitor Slack, Yammer and Microsoft Teams to help ensure their up-time and availability according to their Service Level Agreements (SLAs) and assist in diagnosing when there is a problem.
If you and your teams are collaborating via Slack, Yammer or MS Teams you want to make sure that critical posts and information are getting to the right places in a timely fashion. How can you be sure if you aren’t continuously monitoring? Now with these new CloudReady Sensors you can be confident that posts and messages are being delivered to their respective audiences.
New CloudReady Collaboration Sensors
Exoprise already had customers that were using our all-purpose Web Login sensor for monitoring these services. Now, with new collaboration sensors for monitoring Yammer, Slack and Microsoft Teams, we’ve taken it a step further; these new sensors actually create a dedicated channel (group or team) within the Software-as-a-Service applications, post a message, make sure the message is received and then cleanup to ensure that we aren’t filling up any parts of the application. This simulation of a user using the application is crucial for ensuring that the service is up and running.
You get continuous monitoring and availability of these critical collaboration tools with the same ease of setup and reliability as the rest of the CloudReady platform. And, along with the rest of CloudReady, you get crowd-powered data for fast diagnosis and troubleshooting if the any problems might be just your own tenant or if a outage is affecting everyone – or the entire Internet for that matter.
Lastly, CloudReady Network Path Performance data assists in determining where a network outage might be coming from; your own internal LAN, your ISP, the providers or somewhere in between. Let’s take a deeper look.
1. Setup a Private Site for Monitoring From Your End-Users Perspective
You want to monitor Slack, Yammer or MS Teams from your end-users perspective to understand end-to-end network, bandwidth, latency and quality issues in real-time as well as make sure your tenants are performing well. Read more about how easy we make it to deploy sites. We recommend putting our agent in similar networking conditions as your users will access the application from.
2. Next, Choose a Slack Sensor for Continuous Monitoring
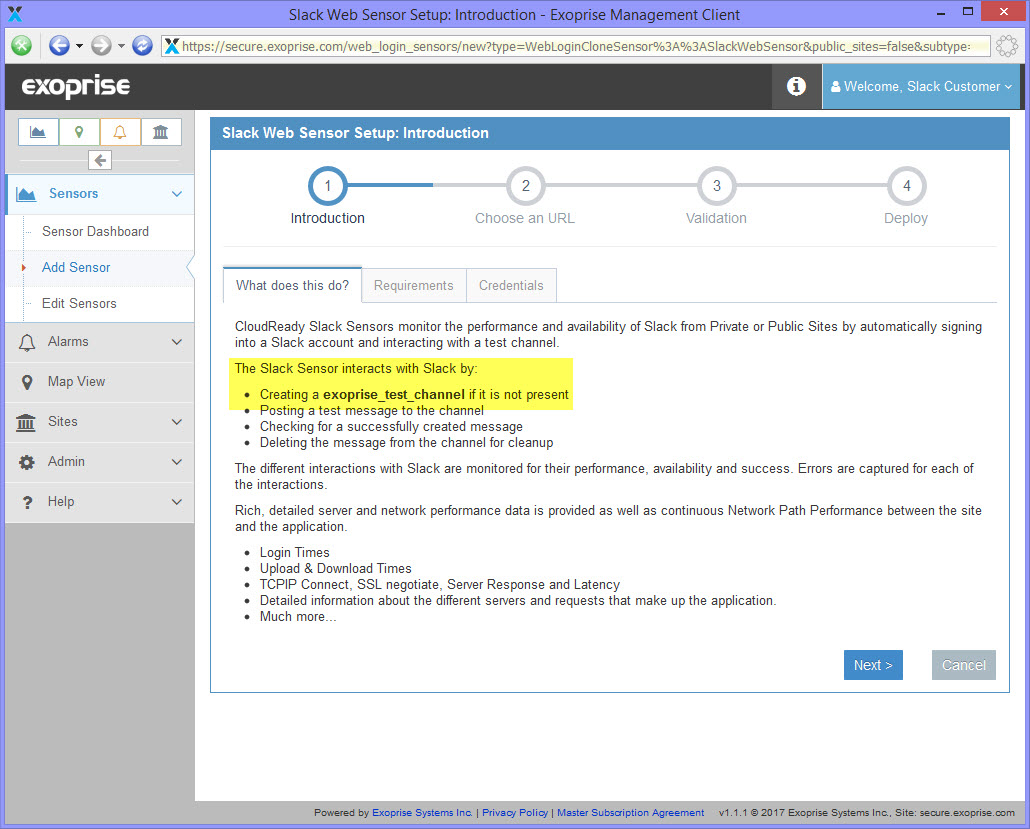
A Slack (and Yammer/Microsoft Teams) sensor utilizes a headless browser to sign into Slack, through whatever Single Sign-On services you might have like Azure AD, Okta, OneLogin, etc., and then interacts with the Slack application to create a channel. Currently, the name of the channel in Slack is fixed and its called exoprise_test_channel.
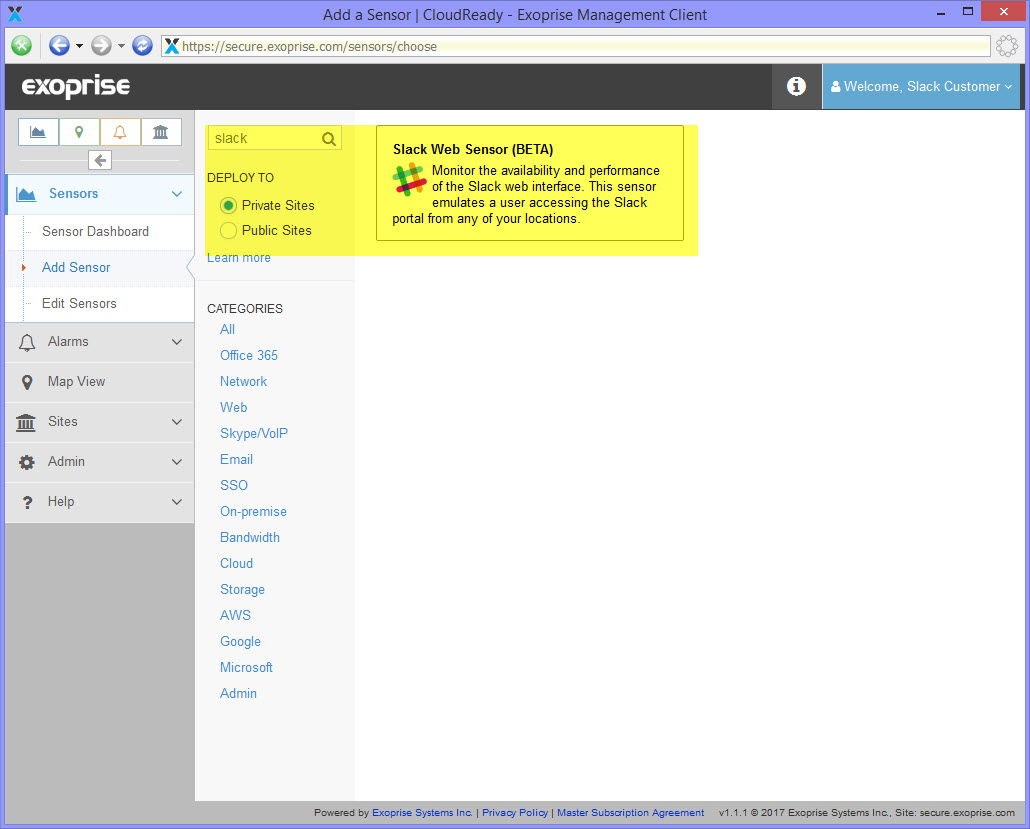
Go to the Add Sensor page and search for a Slack or Yammer sensor. You can search for all of the sensors this way whether they are subset of Office 365, Bandwidth, Network or others.
3. Enter Your Slack Domain and Account Credentials
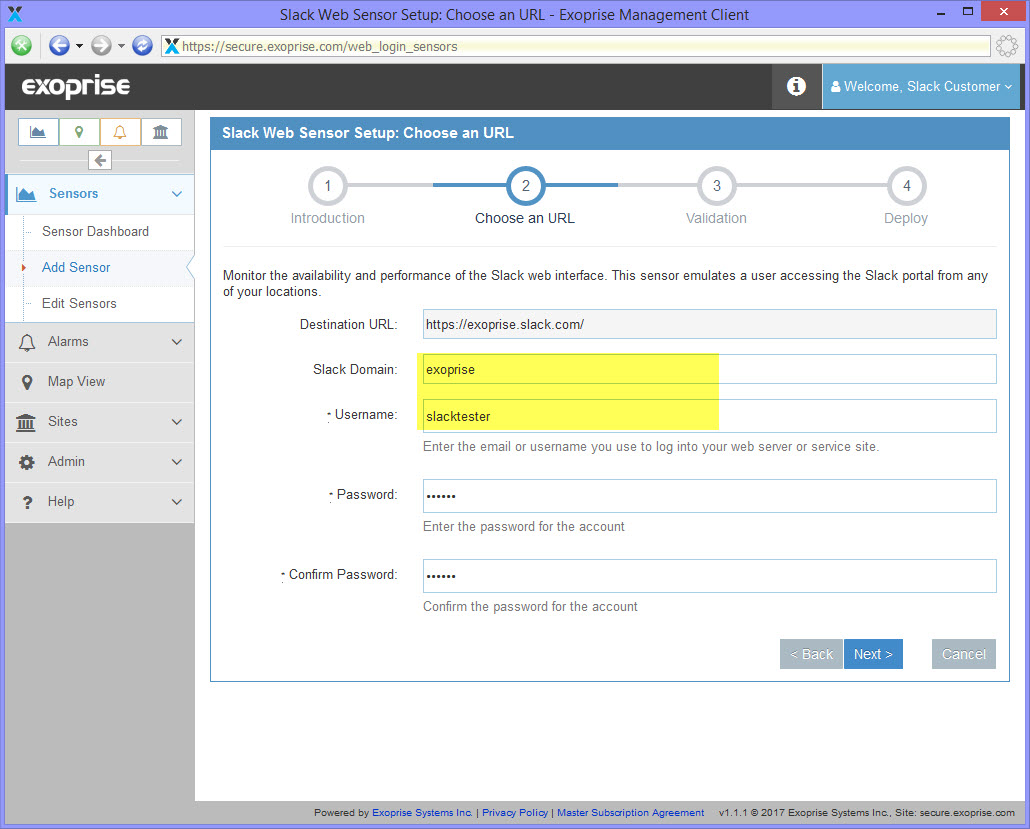
On this page enter the Slack domain you use for your team and the account credentials that you would like to use for monitoring. Even though Slack teams use a custom domain for hosting (just like Yammer and Microsoft Teams), CloudReady will anonymously crowd-source the performance metrics across all Exoprise Customers of the same app.
The domain and credentials are validated for their correctness in the following step. The new sensors operate against any authorization systems that might be in place. This is critical to ensuring that these services are up and running and performing well.
 +
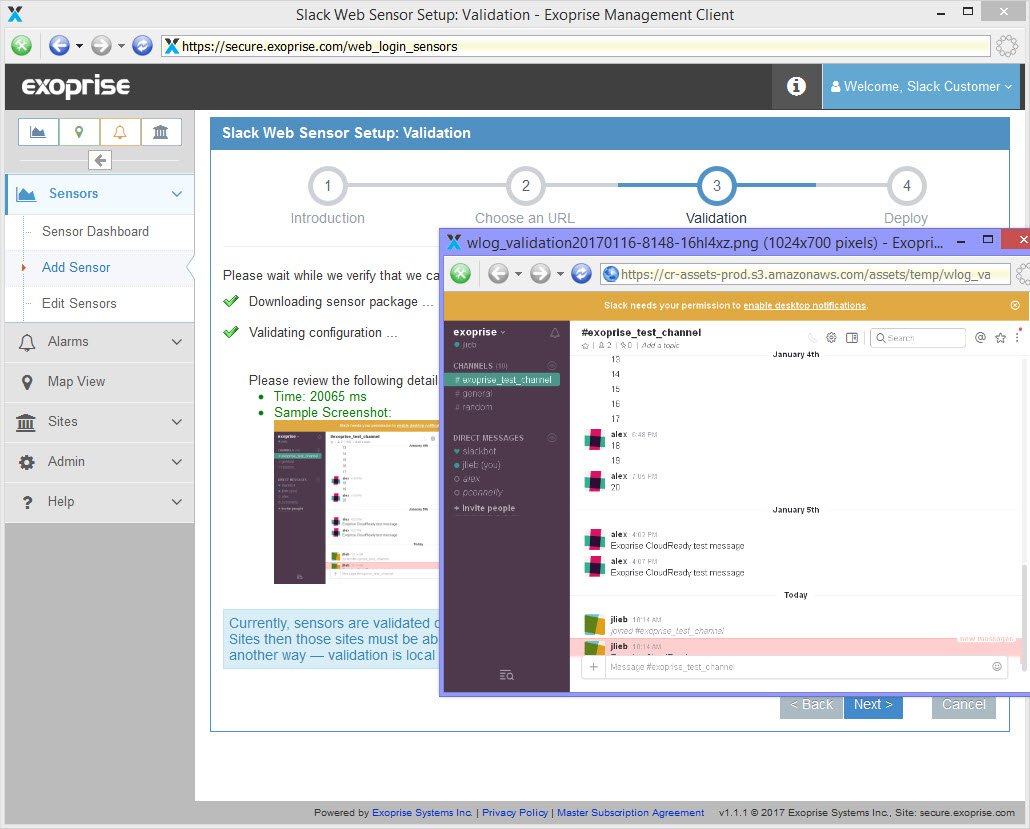
+3. Click Next to Validate the Sensor Before Deployment
If you are setting up a private (inside your firewall) Slack sensor, your domain and credentials will be validated in the Management Client before the sensor is deployed. If you are setting up a Public Slack sensor (hosted on one of our Virtual Machines in the public cloud) the sensor will be tested when its first run and you will be notified of its success or failure via email. If you wish to deploy a Public Slack sensor and validate it before deployment, simple download and run the setup in our Management Client – it will validate like you are setting up a private sensor.
Validation of a sensor captures a screenshot that can help to visualize the sensor operations. Right-click on the sensor image to see what the sensor saw.
4. Finally, Choose a Location For Deployment
Once successfully validated, the Slack sensor and credentials you can deploy it to a private site. If you’re deploying a Public Slack Sensor (monitoring from the cloud) you choose an available location and region to deploy to. Once deployed, give the sensor a few minutes to get going and you should start to see performance metrics for sign-in, channel post and more.
Alarms and Notifications
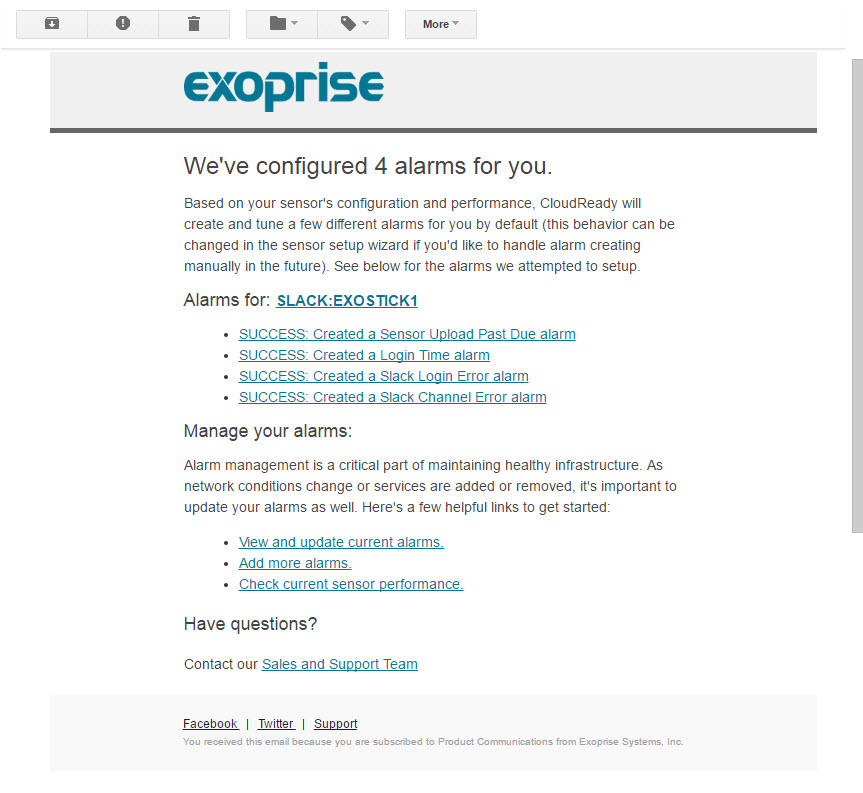
All of the CloudReady sensors automatically configure the most important alarms for you as the sensors are deployed. You choose how long to wait before configuring the alarms which improves the accuracy of alarm threshold configuration. Tuning the automatically configured alarms is easy too – you can do it with a single click once you receive an alarm.
 +
+Example Performance Monitoring Metrics for Slack, Yammer, and Microsoft Teams
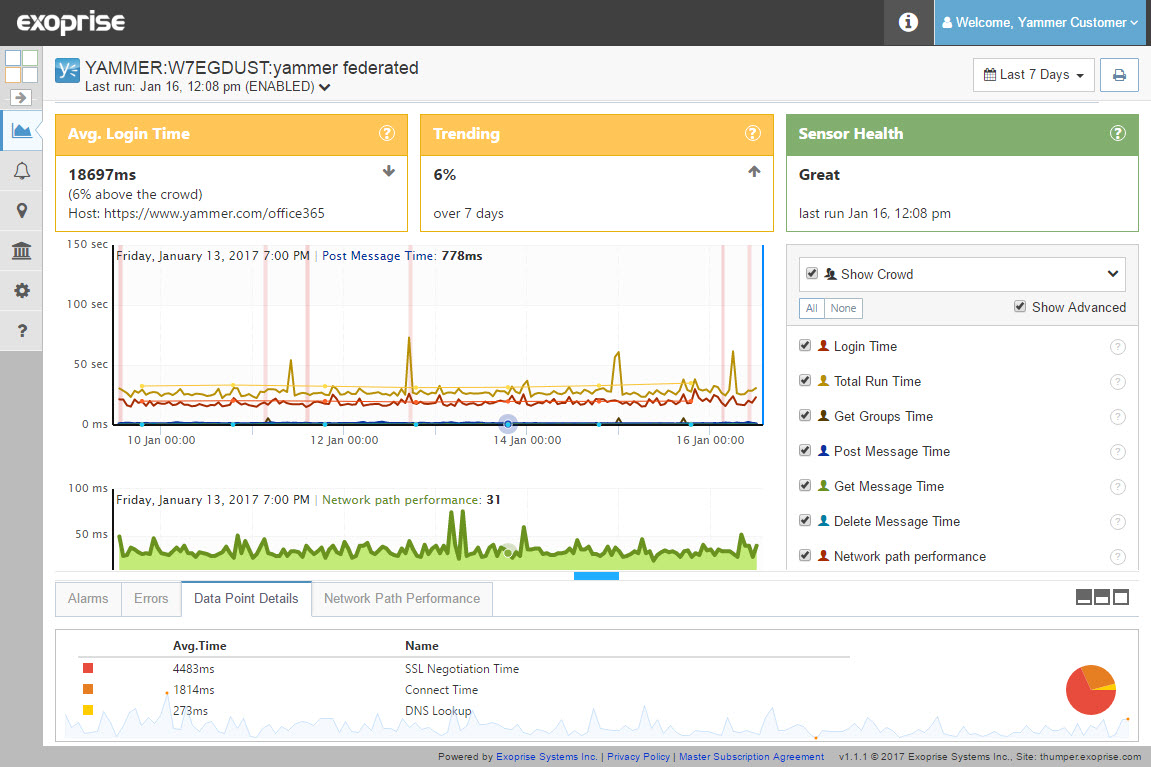
Below is an example of a sensor that is monitoring Office 365 Yammer and leveraging Federated sign-on through Azure AD. You can see many of the detailed metrics including Post Message Time, Get Message Time, Delete Message Time, and more.
 +
+


