With every webpage loaded, email sent, or video streamed, network traffic takes a complex journey…
I hate to say this, but #Omicron is at the doorstep. According to the CDC website, there have been over 60M cases in the US so far. As a result, companies like Google and Apple are delaying returning to the office while some call the return date as now ‘history’. Although we cannot predict the nature of the virus, we have some best practices to help our customers and IT manage their employee experience in a hybrid distributed environment.
Gain Proactive Control by Localizing the Problem

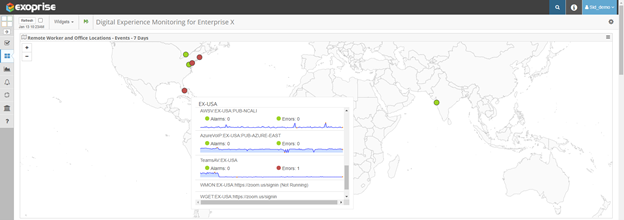
You probably have offices in multiple locations and want to monitor the application and network performance of multiple mission-critical apps such as Microsoft 365, Salesforce, Workday, and so on that your team members rely on every day. Whether you deploy sensors in a public cloud or on-prem, visualizing the uptime and availability of different services on a map is critical. That way, your team can pinpoint issues faster, troubleshoot right away and minimize disruption.
In the following example, you will see that Microsoft Teams has a service problem on a specific site. Click the sensor link to learn more details about the health of the Teams AV application based on metrics such as jitter, packet loss, bit rate, etc.
For more information, see our video on How to Monitor Teams AV Performance.
Manage Microsoft Teams, Zoom, and Collaboration App Sprawl
Your sales team uses Salesforce to manage customer relationships, so you now have the Slack messaging app that comes with the CRM. Windows also offers Microsoft Teams as another collaboration tool. Some users may use Zoom or WebEx for video conferencing. Each tool serves its purpose for different departments, but this leads to a collaboration app sprawl that you need to manage.
As an admin, you often have to answer questions such as: Can we support all of these tools in our ecosystem while still offering employees the highest call quality? What is the system and company-wide usage behavior for these apps? How do various problems with Wi-Fi and network connectivity affect the audio-video performance and availability of communication tools? Where do most of the problems come from?
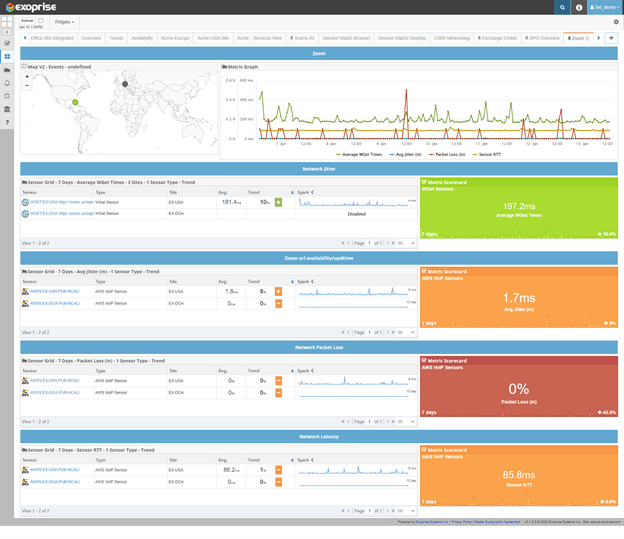
Track the network activity of all your collaboration tools from an endpoint device to the cloud. View all KPIs in a single dashboard and optimize performance for glitch-free meetings.
Understand User Engagement through Benchmarking User Digital Experience
As more and more employees start working remotely (including me!), our contact with the outside world is through a standard web browser (Google Chrome, Internet Explorer) or with communication tools such as Microsoft Outlook, Teams, Slack. In addition, we access SaaS applications every day or use the Teams Desktop app to collaborate on projects. But how do network administrators collectively assess overall performance and objectively measure the productivity level of their employees?
In the lower-left column, you will see two scorecards that provide baseline digital experience scores and trend analysis within a company. The higher the score, the better the engagement levels. After onboarding new employees, compare their experience scores with the rest. Clicking on each of these scorecards provides more detail on troubleshooting.
Learn more about Digital Experience Monitoring and aggregation of scores.

Solve Business Problems with Real User Monitoring Data Widgets
Since the beginning of the pandemic, IT and business have become more aligned and this is obvious. Before the pandemic, when everyone worked from the office, there was physical visibility and personal interaction. But now, the shift towards visibility of experience is accelerating and ensuring that remote interactions and meetings during a conference call run smoothly.
Companies want to know how many users working from different locations are having poor experiences with their Wi-Fi, network, or desktops? How did Microsoft Teams migration or new application rollout go? Was the mass introduction of high-performance workstations a long-term success for all employees? Can the costs or investments be justified? Your team will be accountable and invited to provide inputs to these issues.
We already offer multiple templates, but you can create your custom dashboards and visualization reports and stay confident when your answer executives. Drill into each of these widgets and discover meaningful, actionable data.

IT Makes Work Better with Synthetic Monitoring and RUM
We hope these tips have been helpful. Sooner or later, you will need to optimize your monitoring strategy in 2022 to include digital experience monitoring and consider several remote employee issues that hinder productivity. From locating a problem to customizing your dashboards, support teams can do a lot with Exoprise. So, get an idea of our platform and see for yourself why a mix of synthetics and real user monitoring is more valuable for your organization.
Request a demo, and we will be happy to answer all your questions.
