With every webpage loaded, email sent, or video streamed, network traffic takes a complex journey…
As previously detailed on the Exoprise blog, the ICMP (Internet Control Message Protocol) is crucial for troubleshooting, monitoring, and optimizing network performance in today’s Internet-connected world. Despite historical security concerns, disabling ICMP is unnecessary and hampers network troubleshooting efforts. Modern firewalls can effectively manage the security risks associated with ICMP.
Ensuring ICMP is enabled, whether behind a home gateway/ISP or within corporate LAN/WAN environments, means being able to diagnose and pinpoint network congestion, capacity, latency and other issues. When the need arises to diagnose network connectivity or application response times, Instead of blocking ICMP entirely, organizations should focus on securing their networks while making effective use of ICMP for network management and monitoring.
How Do Exoprise Synthetics Utilize ICMP?
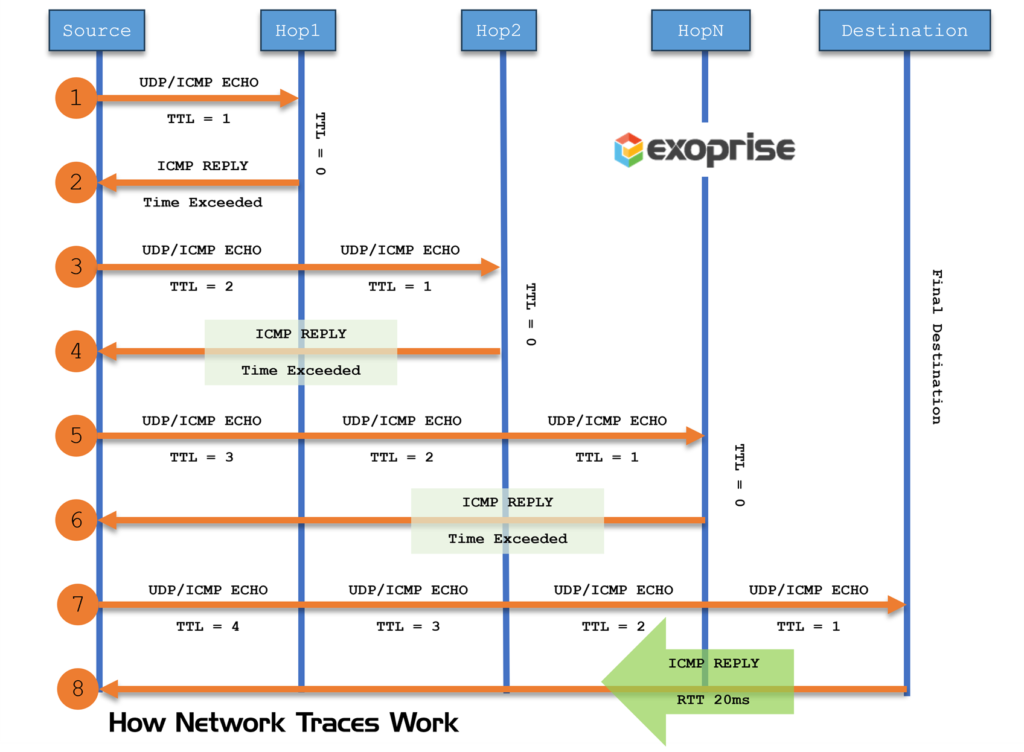
When ICMP is available (we really need inbound ICMP telemetry—otherwise you get nothing), Exoprise synthetics produce network traces and traceroute captures between the site, sensor and the ultimate destination depending on the type of sensor. Examining network nodes and their respective latencies can help pinpoint trouble.
All the Exoprise synthetics, whether simple ones like Web Login or more complex ones like the Teams Audio Video sensor, capture the final destinations for the packets that make up the core transaction. The rules for extracting the destination IP vary by application, customer network architecture, or in-data path security products. Here are some examples:
- OneDrive sensors will navigate to the domain-my.sharepoint.com and perform their tests against the OneDrive account, ensuring acceptable upload bandwidth, download speed, and latency. The sensor captures the underlying IP-address and starts an ICMP trace to detect which nodes and ASNs in the network path are slow, and any network congestion might exist.
- The Teams Audio Video sensor executes a synthetic AV conference call with an Exoprise BOT hosted in Azure and captures the IP-address for the media relay server. The address, which can change for each invocation, is analyzed and ICMP is utilized to detect slow nodes, nodes with high variability (jitter), and packet-loss.
- When a customer’s sensor is used for testing cloud proxy or SASE overhead (Netskope, Zscaler, etc.), all the Exoprise synthetic sensors will record the hop-by-hop latency and metrics to the proxy from the workstation (Private Site) where Exoprise is installed.
Ensuring network traces are going to the correlated IP-address during the transaction is critical to diagnosing network conditions. Independently tracing to IP destinations that are not reflective of the actual transaction won’t do anyone any good – you want to ensure an accurate analysis at the time of the transaction, which Exoprise does with care.
How Does Exoprise Service Watch Utilize ICMP?
Service Watch, our real-user monitoring platform, leverages ICMP to detect network performance problems on behalf of actual users while they’re utilizing their networked applications. Service Watch continuously captures the IP destinations that are most used by core applications from the user’s endpoint and perspective. Here are additional examples:
- For browser-based applications, the Service Watch Browser add-on can utilize either a common, central Exoprise site to perform its network tracing or, if Service Watch Desktop is installed on the users’ machine, the local site. A central private site can be ideal for monitoring web applications like Salesforce and providing network telemetry across a LAN/WAN or SDWAN.
- As Service Watch browser captures timings for domains it’s configured to monitor, it will have Exoprise servers distribute trace requests to the common sites. If Service Watch Desktop is installed, the Chrome or Edge browser extension will utilize a local channel to have the network trace executed. Service Watch Desktop can either reply with the trace or independently upload it to our servers.
- Service Watch Desktop keeps track of core applications—the list can be customized by customers. For core networked apps, including apps like Microsoft Teams, Zoom, or Cisco Webex, Service Watch Desktop will monitor TCP/IP connections as well as UDP packet sends and receives. At least every 15 seconds, the connection, and packet rate are computed, and destinations analyzed via network traces and traceroutes for an end-to-end perspective of network path performance. Some examples of how network diagnostics are valuable across applications include:
- For Microsoft Teams, Service Watch Desktop immediately detects a VoIP, Screen-sharing, or Audio Video call in progress, within 5 seconds of starting one. Service Watch then starts capturing trace diagnostics to the media relay server, and this connection and hop-by-hop diagnostics is continuously captured at least every 15 seconds.
- For Microsoft Outlook, the TCP/IP latency overhead as measured by the kernel OS is recorded, as well as network traces to the Exchange Online server and nearest Microsoft front door. Whether SASE layers are installed, or the socket connections are all the way to the Exchange servers, Service Watch can detail latency, jitter, and packet loss for the connections.
- If on a Zoom or Webex call, we immediately detect the UDP send/receive packets to the Internet IP destinations. We capture node-by-node telemetry for these core applications as well. Just like we do for every other core application like Teams, RingCentral, Avaya IP, and more.
What’s Captured as Part of Our Network Path Performance?
These aren’t your father’s tracert/traceroute calls. Exoprise tools and services combine endpoint data, cloud data, peer data and more to capture an incredible amount of low-level data for network path telemetry. And we leverage the best of each operating system to do so.
Windows Kills Raw-Sockets
Long ago, on Windows 95, Microsoft made the consequential decision to kill off raw socket access from the Windows user space. Even with administrative privileges. This has had consequences for network telemetry (among other consequences) for years. Now, on Windows, the only way you can get access to raw sockets where you might execute an ICMP interrogation or UDP packet with a short Time-to-Live (TTL) is via a device driver. This is something the Exoprise team has considered but is hesitant to do for our customers. If the rewards don’t justify the low-level access that’s required or ICMP access and Microsoft’s iphlpr.dll can’t be utilized.
macOS Relies On Unix/Mach OS Underpinnings
On macOS, Apple utilizes the User Datagram Protocol (UDP) for its network tracing though Exoprise has built in support for ICMP and TCP/IP as the source protocol of short-lived network discovery packets. Currently, we utilize UDP packets for network discovery as the native traceroute tool does on macOS but offer the choice to customers that TCP/IP and ICMP can be used as well.
We find, through testing and historical comparisons, that UDP can be more accurate in near-by network path hops but less aggregate in the middle of the Internet or near the provider destination. Different routers will throughout short TTL-based packets depending on their formation.
Linux Flexibility For the Win
Currently, Linux OS (Ubuntu is where we do most of our testing and deployment) relies on UDP tracing as well as macOS. Service Watch Desktop has chosen to utilize ICMP for the Linux platform to maximize compatibility with the Windows platform. But we can offer a customer the choice of underlying protocols if they really desire to.
A Multi-faceted, Multi-Platform Network Trace Approach
Network traces and ICMP remain a vital protocol for DEM-based network discovery and monitoring, no matter which operating system is being utilized. Regardless of OS-dependent protocol, Service Watch performs low-level, customized network traces based on a range of factors:
- Duration of node-by-node timeouts
Often, depending on the application discovery, Exoprise traces will vary the timeouts based on the distance to the node being measured, shorter with nearby hops, longer with distant hops. This makes for more efficient network traces. - Packet Size variance depending on the application being monitored
For the various core apps that are monitored or synthetically transacted, Exoprise will vary the packet size to emulate the app. For Unified Communications apps, the packet sizes are often smaller as opposed to HTTPS transactions where the MTU is more closely followed. - Null-hop variance and historical context
To speed up network traces (we do millions of them a day), we record historical hop availability from each endpoint. If we know that destinations are not reachable, we will shorten the time it to takes to execute a trace if it fits a pattern. - ASN/Peer discovery (including IXPs/backbones in the middle)
For every recorded network trace and path discovery, Exoprise analyzes the peers and Autonomous System Numbers (ASNs) of each network segment for comparison, benchmarking, and crowdsourcing. - Unreachable destinations measure the Syn/Ack Timing
Finally, if the final destination is unreachable, we capture a Syn/Ack timing of a TCP/IP connect. This metric combined with the OS kernel perspective on round-trip-times make for an accurate perspective on network latency of every core application connection on a machine.
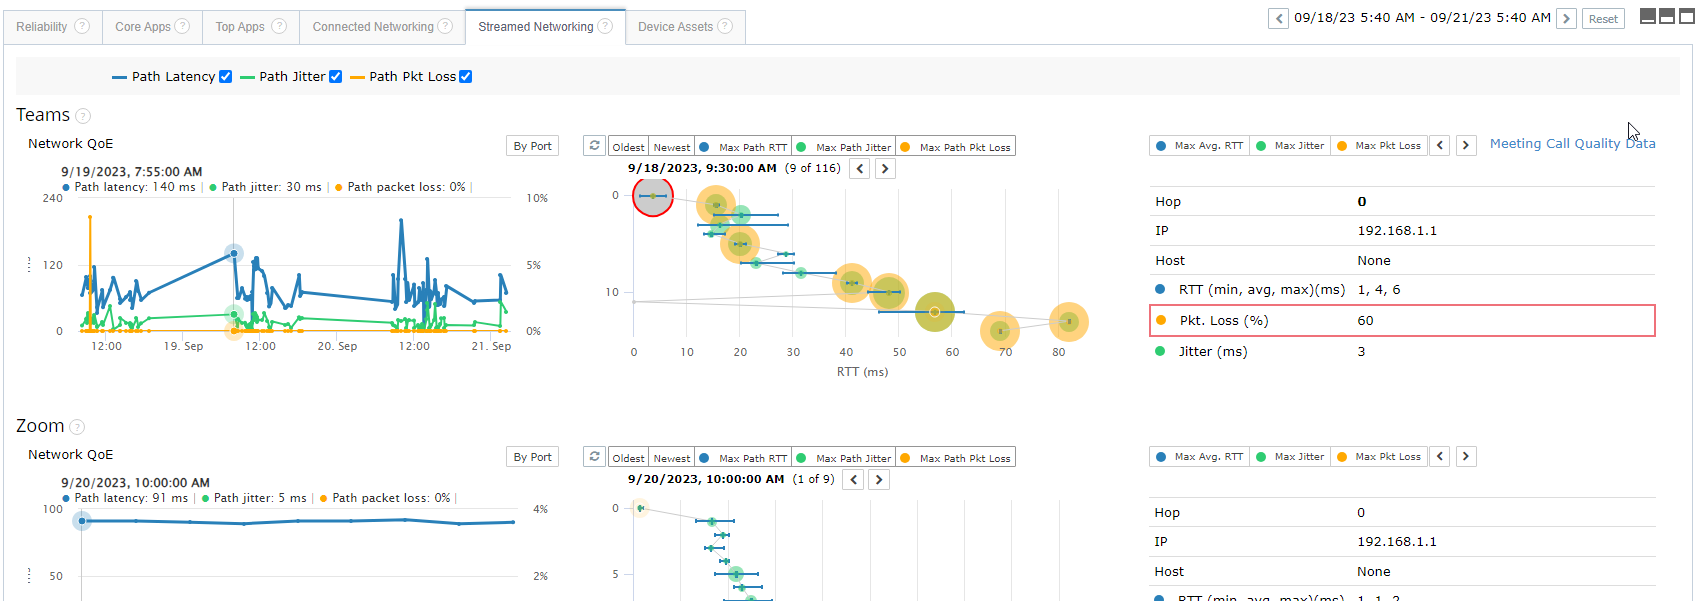
Service Watch executes network traces and network path discovery across all platforms using multiple background threads along with algorithmic adjustments. This allows for fast network path measurements that correlate with real-user experience metrics or synthetic cloud tests. Exoprise estimates that its performing millions of network traces per day on behalf of its customers.
