With every webpage loaded, email sent, or video streamed, network traffic takes a complex journey…
As organizations continue to embrace digital transformation, Desktop-as-a-Service (DaaS) has become a popular solution for delivering virtual desktop environments to employees. With the flexibility, scalability, and security Virtual Desktop Infrastructure (VDI) offers, DaaS has the potential to streamline operations and boost productivity. However, this technology is not without its challenges, particularly when it comes to managing and monitoring end-user digital experience or DEX/DEM.
One of the significant issues that organizations are facing with DaaS is the increase in support tickets related to performance and usability issues. This trend is significant as it not only impacts employee productivity but also puts a strain on IT support teams. In this article, we will explore the reasons behind the surge in support tickets related to DaaS and discuss how digital experience monitoring can help address these challenges.
Network Connectivity, Latency, and Response Problems with VDI
One of the primary reasons for the increase in support tickets related to DaaS is network connectivity issues and response times. Since DaaS relies on a stable and high-speed internet connection to deliver remote desktop environments to users, any disruptions or latency in the network can lead to performance issues. Users may experience slow response times, lagging applications, or even complete outages, prompting them to contact the support desk and log support tickets.
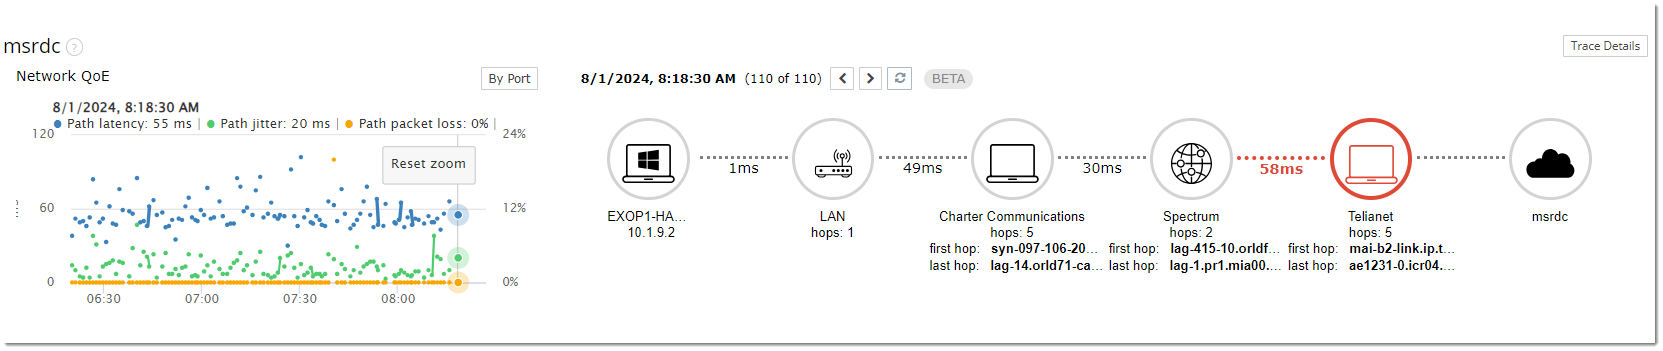
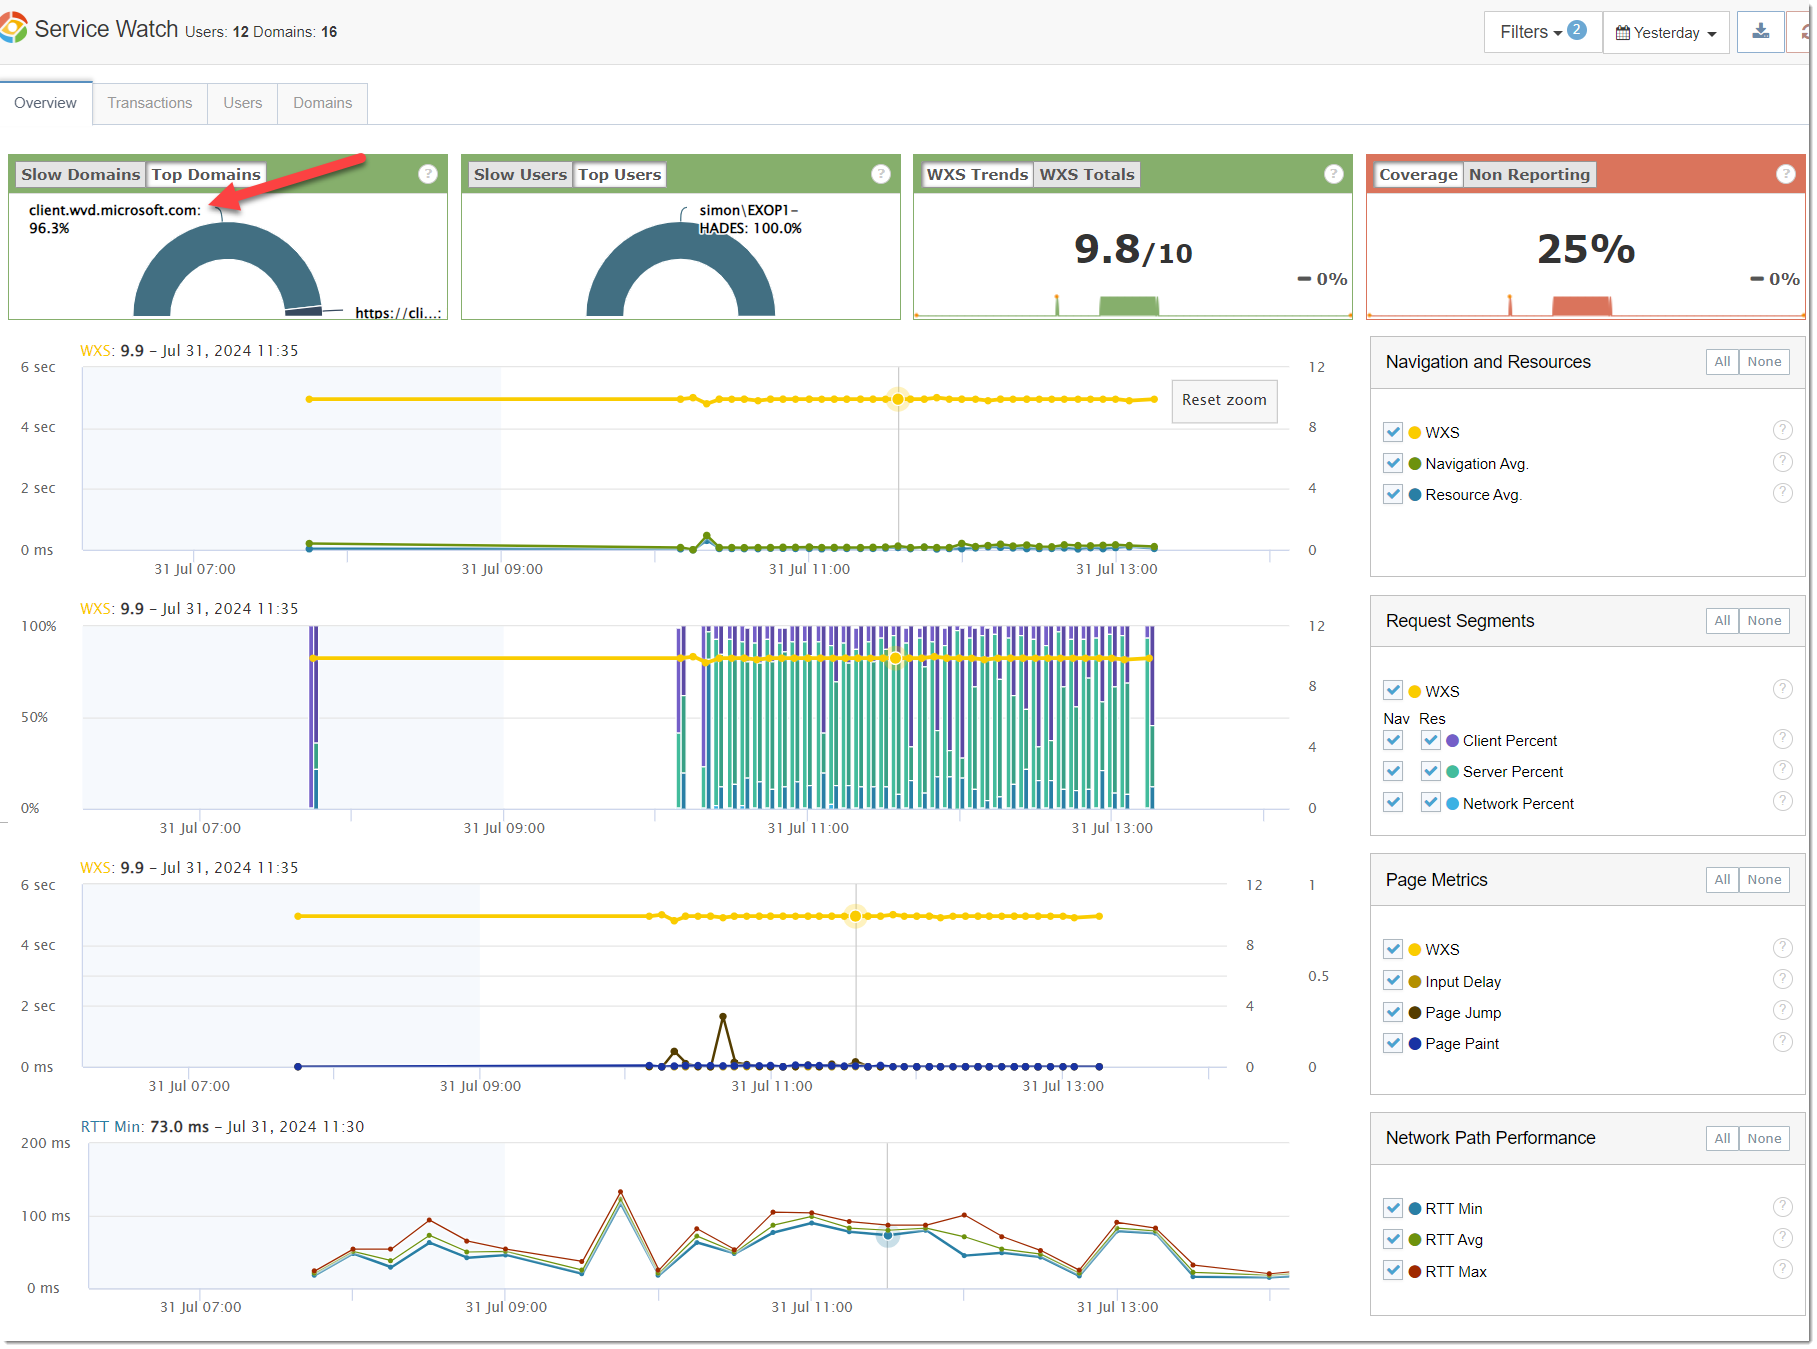
Digital experience monitoring tools can help pinpoint and troubleshoot network connectivity issues by providing real-time insights into the network path and record benchmarking metrics for a 24×7 view. By monitoring network latency, bandwidth utilization, and packet loss, IT teams can proactively address connectivity issues before they impact user experience. Additionally, these tools can provide visibility into the user’s connection quality, helping pinpoint the root cause of performance issues. With Exoprise Service Watch, this network path visibility is continuously recorded for remote users, no matter where they work from. Network administrators can immediately pinpoint the culprit for slow VDI response and determine whether it’s the local LAN, Wi-Fi gateway, ISP, backbone or VDI providers.
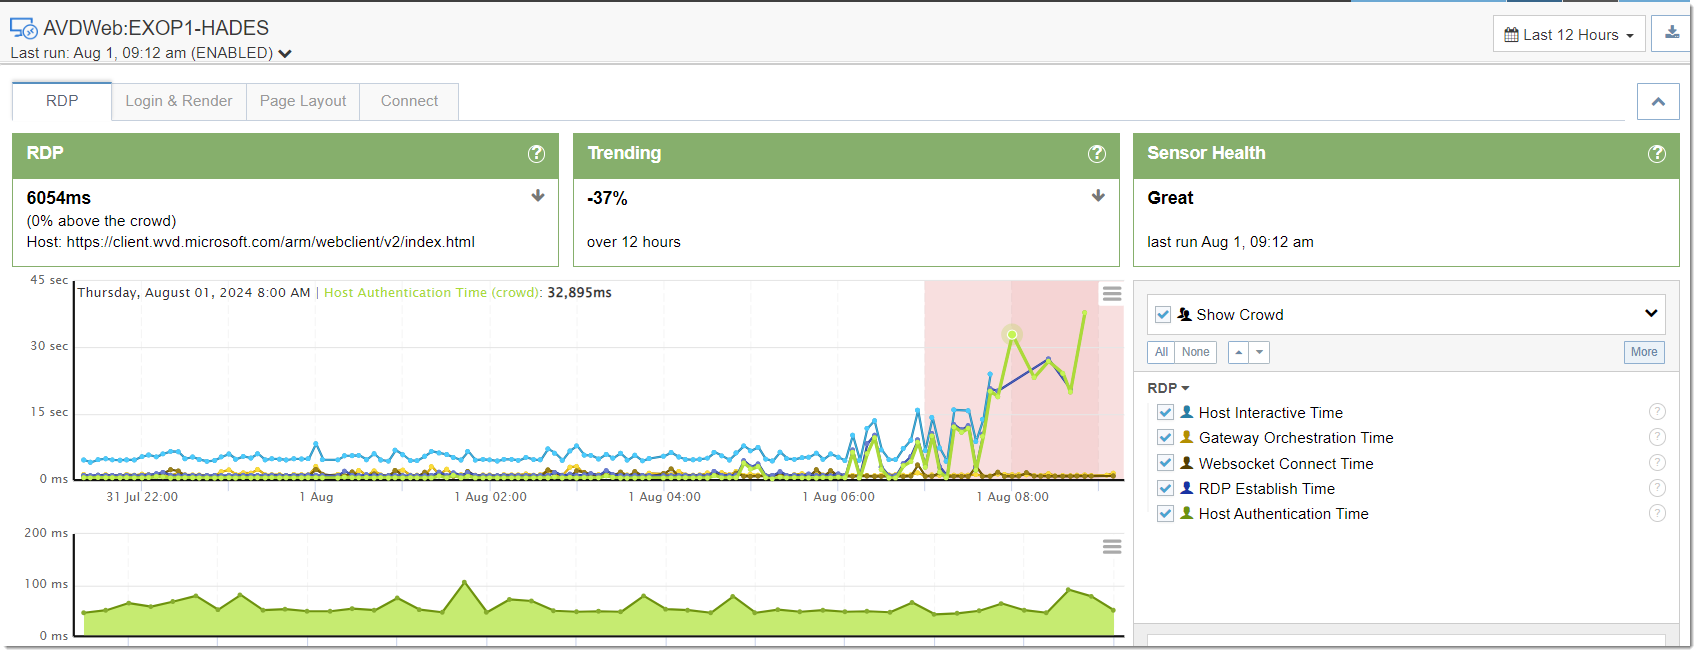
Network telemetry for DaaS covers in-house networking, internet, cloud platform internal networking (as an example, Azure has several layers to consider), as well as remote worker home networks. Exoprise “Better Together” with CloudReady synthetic sensors, Service Watch (browser and desktop), and Service Watch Active Test provide a comprehensive view along the network paths, no matter how opaque they may seem. End-to-end visibility of the network conditions is easily accessible through the dashboards, along with comparative data from crowdsourced telemetry. Issues can be resolved for faster MTTR.
Exoprise Service Watch can be installed both inside the Virtual Machine or outside from the remotely connecting host. Often, customers have Virtual Private Networks configured into the Virtual Machines for controlled access to corporate resources by consultants and outsourced workers. This is often referred to Zero Trust for the resources accessed within a VM.
By utilizing Exoprise Service Watch inside a VDI device or Virtual Machine, you can detect hosting network slowdowns when VDI users are trying to access corporate, cloud, SaaS or web applications that are required for work.
Resource Allocation and Scalability
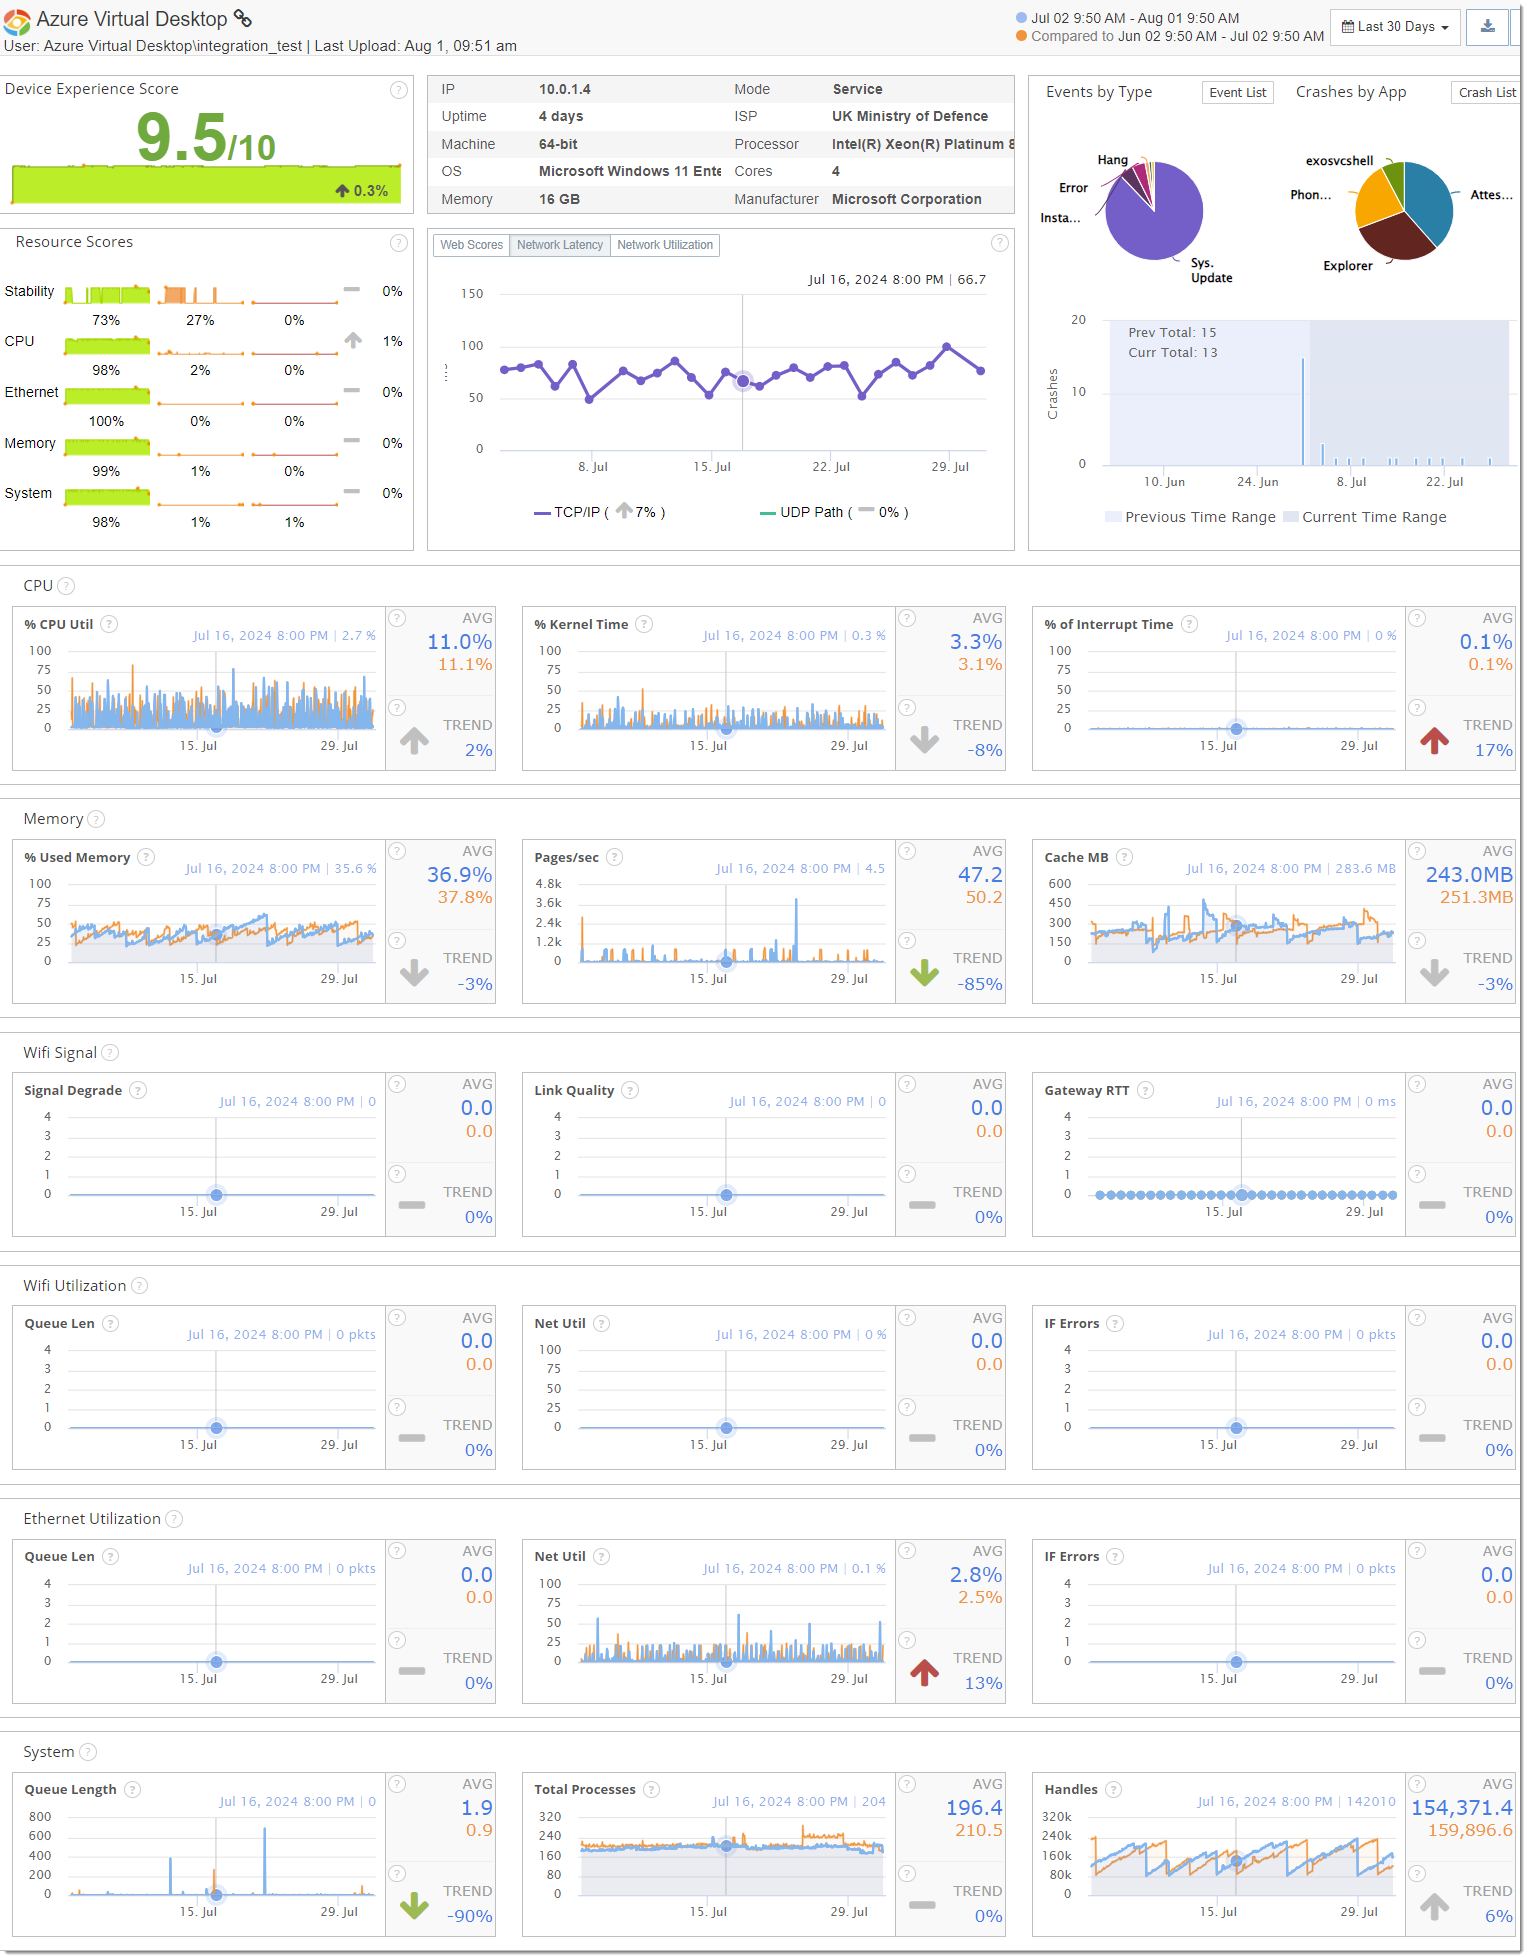
Cloud implementations commonly result in increased in support tickets related to DaaS due to inadequate resource allocation and scalability. DaaS environments need to be properly provisioned with the right amount of computing resources to ensure optimal performance. If the virtual desktops do not have sufficient CPU, memory, or storage resources, users may encounter performance degradation or application crashes, leading to support tickets.
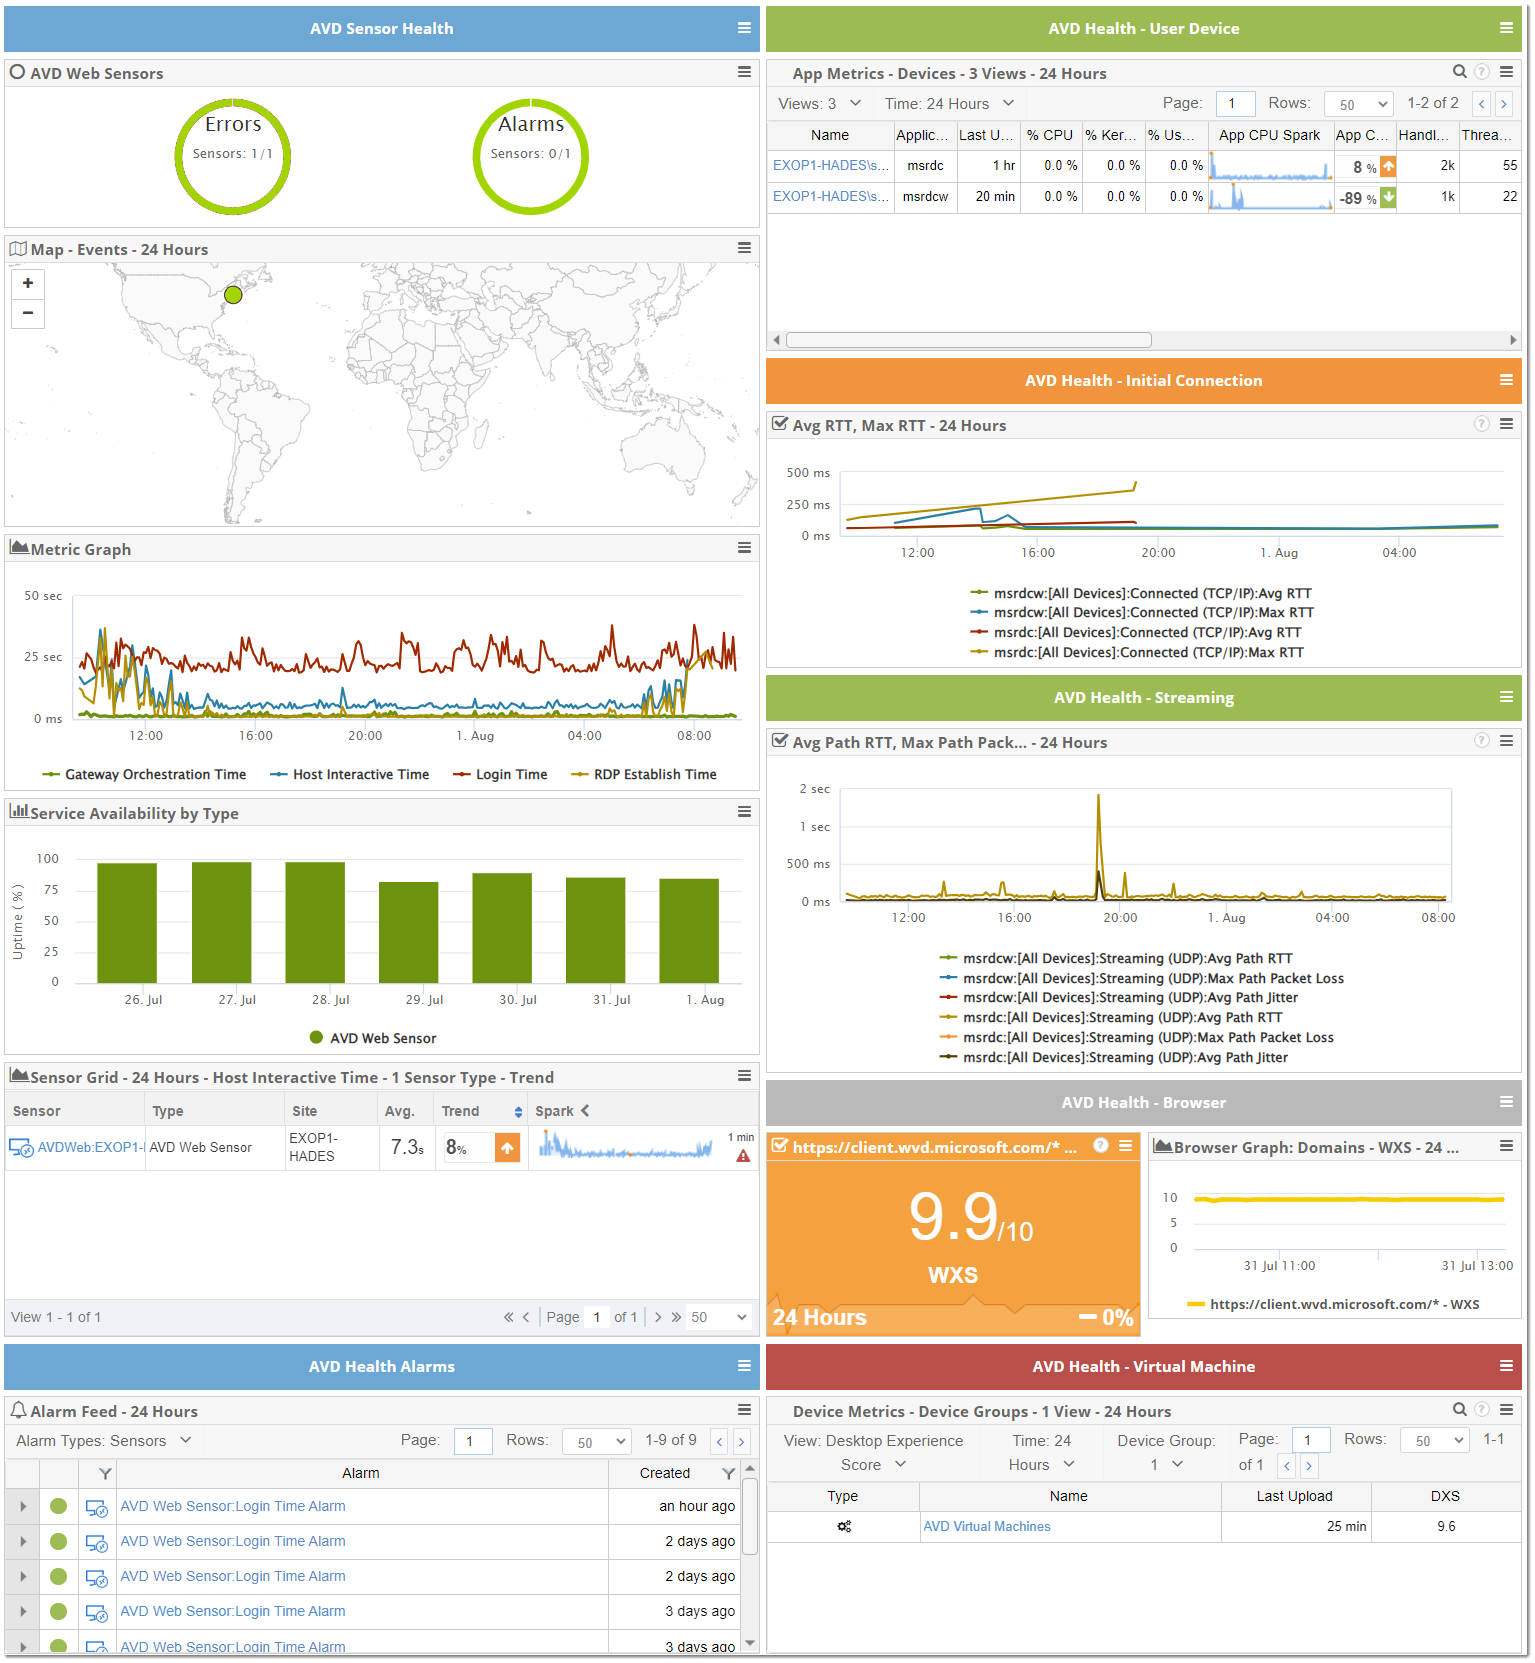
Digital experience monitoring tools can help IT teams monitor resource utilization in real-time and identify any bottlenecks or resource shortages. By tracking CPU usage, memory consumption, I/O metrics, and detailed hop-by-hop network telemetry, organizations can ensure that their DaaS environments are properly sized and configured to meet user demands. Additionally, these tools can provide insights into workload patterns and trends, enabling organizations to anticipate resource requirements and scale their environments accordingly.
DaaS implementations can be tricky, but with Exoprise Service Watch in its various forms (browser, desktop, and Service Watch Active Test) deployed to virtual desktops, you can gain a clear understanding of what’s happening with all digital devices on a cloud platform. With dashboards down to the device level, support teams can determine what actions are necessary for alleviating issues from high CPU usage, memory consumption, and impediments to disk performance. Service Watch returns important data to resolve every DaaS device issue and get users working effectively for higher DEX satisfaction among employees.
Application Performance and Compatibility
Another factor contributing to the increase in support tickets related to DaaS is application performance and compatibility issues. DaaS environments often host a wide variety of applications, ranging from productivity tools to specialized software. If these applications are not optimized for virtualized environments or lack compatibility with the underlying operating system, users may experience performance issues or application failures, prompting them to seek IT support.
In-VM, digital experience monitoring tools can help organizations track application performance and compatibility in DaaS environments by monitoring application response times, error rates, and dependencies. Proactively measuring poorly performing apps, IT teams can take steps to optimize or troubleshoot them, reducing the number of support tickets. Additionally, these tools can provide insights into application usage patterns and user behavior, helping organizations make informed decisions about application deployment and management.
Again, with Service Watch Browser and Desktop as well as the lightweight synthetics of Service Watch Active Test available on all digital devices, applications and processes are easily identified for remediation. With a wide range of information available, application performance can easily be improved, reducing support tickets with improved MTTR.
Conclusion
The increase in support tickets related to DaaS is a significant challenge that organizations need to address to ensure a seamless user experience. By leveraging digital experience monitoring tools, organizations can gain real-time visibility into their DaaS environments, proactively identify performance issues, and optimize resource utilization. By monitoring network connectivity, resource allocation, and application performance, IT teams can effectively troubleshoot issues, reduce support tickets, and improve user satisfaction. As organizations continue to embrace DaaS as a key component of their digital strategy, digital experience monitoring will play a crucial role in ensuring the success of these initiatives.
With Exoprise “Better Together” a high volume of support tickets can be resolved with effective MTTR. CloudReady continuously gathers information with low impact on networking. Effective visibility along network paths, over every hop possible, are gathered, lending clear focus on the problems to get users back to their tasks.
Additionally, Service Watch is a fantastic tool to deploy to all virtual machines. With a wide range of RUM and synthetic monitoring available, all forms of Service Watch add to IT support staff views of all of these devices. Applications and virtual “hardware” can be assessed for remediation, improving DaaS environments and lowering the number of support tickets as well as the MTTR of those issues that do occur. Many times, problems are identified before they blossom into some far larger, preventing a large influx of reported issues.
Related Posts


