With every webpage loaded, email sent, or video streamed, network traffic takes a complex journey…
In today’s fast-paced, digitally driven world, monitoring network performance has never been more critical. Whether you’re a small business, or a large enterprise, understanding the complexities of Voice over Internet Protocol (VoIP) and bandwidth is crucial for delivering an exceptional user experience.
In this article, we’ll dive into the powerful CloudReady synthetics and Service Watch Desktop for real-user monitoring features. Designed to provide understandable insights for network transformation or proper base lining and monitoring in your environment.
If you’re looking for proactive office monitoring or to ensure your infrastructure is running at peak performance, you’re in the right place. Let’s get into how Exoprise can help you!
Monitoring Bandwidth
In today’s SaaS and cloud-oriented environment, bandwidth and latency monitoring isn’t just a convenience but a necessity for businesses. When issues arise, they can bring an organization to a halt. Slow load times and unresponsive business-critical applications lead to user frustration and loss of confidence in the teams in charge of these systems. When this occurs, everyone suffers.
The right choice for a bandwidth monitoring solution is about more than just performance drops. These tools must also alert you while providing understandable information into the cause. Here are some factors we find key when considering a proactive monitoring solution:
- Optimizing Network Performance
- Identify bottlenecks where the network is congested to improve performance
- Ensure sufficient bandwidth to handle current and future demands preventing slowdowns
- Ensuring Quality of Service (QoS)
- Maintaining service levels for services that rely on data transmissions such as VoIP, video conferencing, and streaming
- Prioritizing traffic by understanding bandwidth usage to ensure services are uninterrupted
- User Experience
- Improving end-user satisfaction by ensuring sufficient bandwidth is available to end-user operations
- Supporting business operations that are customer-facing or cloud service reliant
- Capacity Planning
- Forecasting needs by base lining the network pre- and post-network changes
- Scalability planning by having an understanding of bandwidth usage
With the high bandwidth requirements of newer technologies, such as Desktops as a Service (DaaS) and VPNs, obtaining this visibility is critical for both in-office and remote workers. Get ahead of users’ complaints by properly monitoring the organization.
Monitoring VoIP
With the reliance on digital communications, the importance of monitoring VoIP performance cannot be stressed enough. With all the moving pieces, the risk of compromised quality and reliability is ever-present, which can be extremely problematic. Having the right solution in place makes this exponentially easier, though.
When considering a VoIP monitoring solution, it’s important to understand the key components that constitute an effective VoIP monitoring solution. The most critical features and functionality required are:
- Ensuring Call Quality
- Tracking latency for delays in data transmissions which cause delays and echo’s
- Minimizing jitter which causes choppy and garbled audio
- Prevent packet loss to significantly improve call quality
- Maintaining Reliability
- Outage detection to proactively notify users of disruptions
- Ensuring service consistency to ensure availability
- Optimizing Resources
- Properly allocating bandwidth for effectively maintaining call quality
- Prioritize traffic for VoIP such as prioritizing voice packets over less critical data
- Improving User Experience
- Enhance user satisfaction by base lining over periods for improvements
- Supporting remote users to ensure access to high-quality voice services
Having the visibility and understanding of the above makes a world of difference when monitoring VoIP performance. Lacking these details will substantially increase the time to resolve problems when they arise.
CloudReady Monitoring
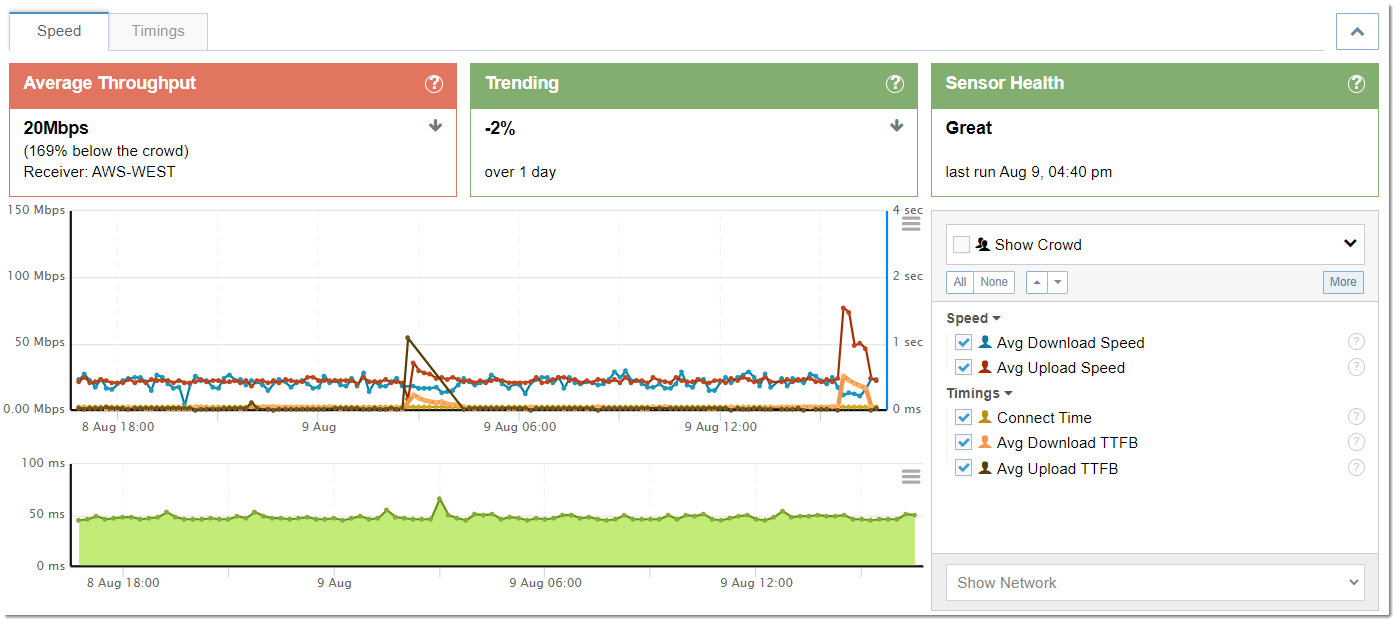
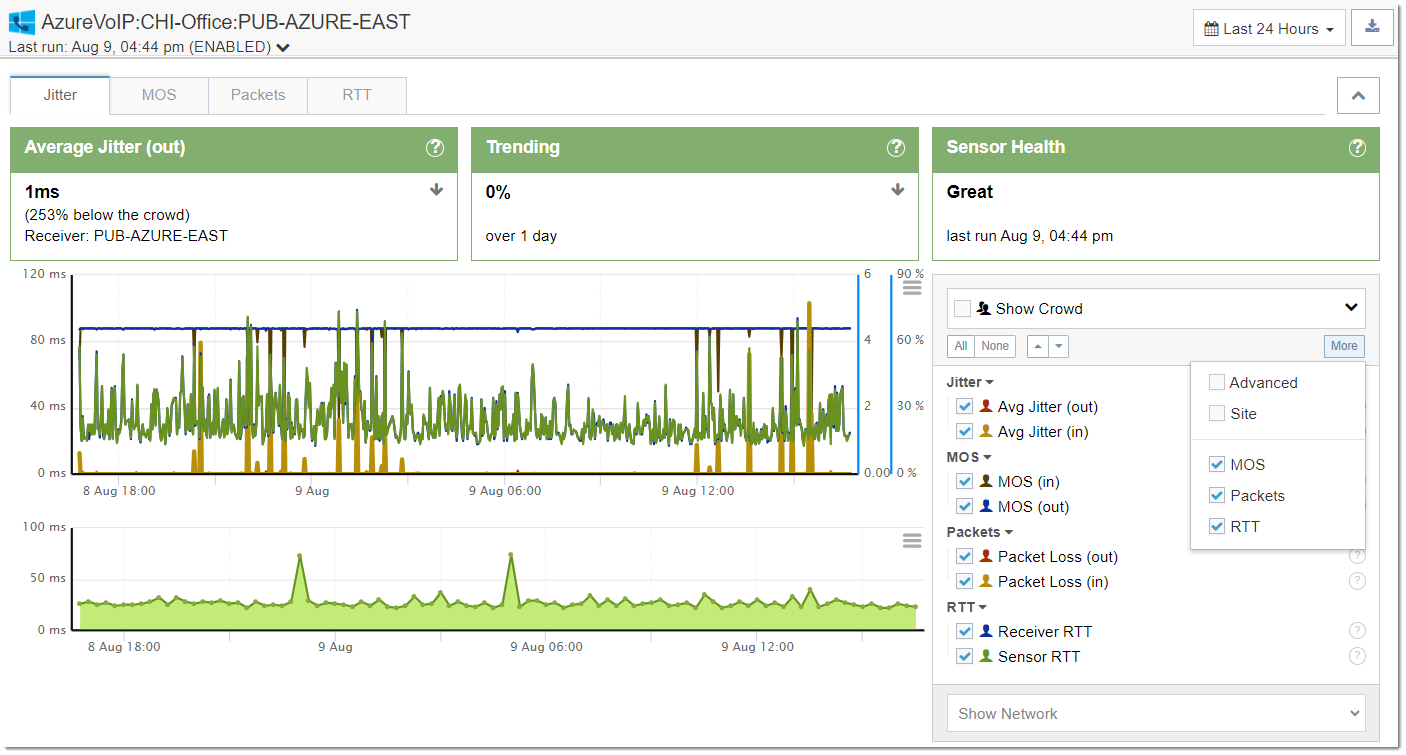
Monitoring bandwidth and VoIP performance is quick and simple with Exoprise CloudReady synthetic monitoring. Organizations gain real-time insights into performance degradation across Microsoft, Amazon Web Services, and office-to-office connections with this powerful tool. Various deployment methods are available to ensure CloudReady provides a clear understanding of network performance, no matter the design of the network topology.
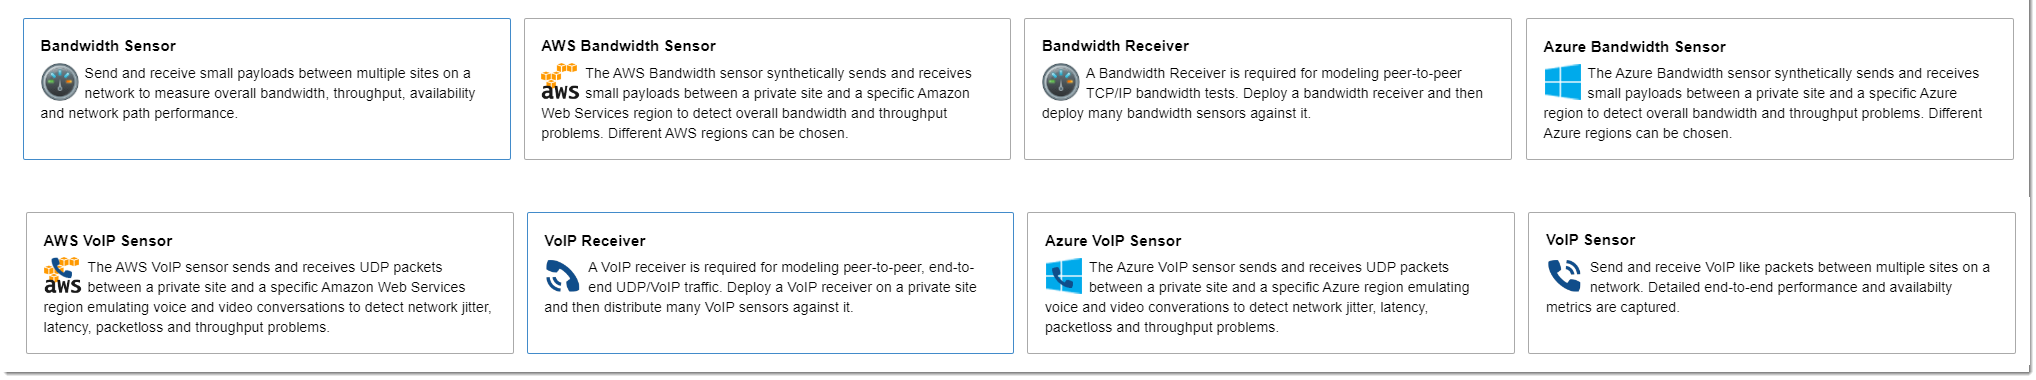
To understand the different deployment options and their benefits, we have listed them below:
- Azure Receivers
- Exoprise hosted receiver
- Tests Azure performance, proactively identifies slowdowns and outages
- AWS Receivers
- Exoprise hosted receiver
- Tests Amazon performance, proactively identifies slowdowns and outages
- Private Receivers
- Deploy your receivers to offices, data centers, and hosting providers
- Test end-to-end performance of branch office and VPN infrastructure
Regardless of deployment, the process is wizard-driven and will also test functionality during the initial deployment process, preventing bad deployments when they would fail.

Once deployed, the synthetics baseline the environment for a specified period and calculate the correct thresholds for proactive alarms. These alarms can be aggregated to improve accuracy, identify region-specific issues, or proactively notify responsible resources. These alarms can also be configured to generate incidents in ServiceNow and other ticketing systems as well.
When utilizing hosted receivers, all the performance metrics are crowdsourced allowing customers to easily compare their performance to other Exoprise customers. For self-hosted receivers, customers can compare the performance metrics between their sensors and receivers to identify which connections are performing worse.
With flexible deployment options and rich data collection, CloudReady simplifies monitoring both bandwidth and VoIP performance, helping you ensure a seamless user experience and get ahead of issues across the organization.
Supporting Remote Workers with Service Watch
What about users working from home, or in a location not covered by CloudReady? Service Watch Browser and Service Watch Deskop is the answer. Service Watch for Real-User Monitoring, is deployed to end-user devices, Windows and macOS, to monitor your remote workforce’s real-world experience.
Service Watch actively collects device performance information as users go about their daily tasks. The collected metrics include device and application resource usage, network telemetry, ISP performance, browser performance, and more. With this visibility, engineers can quickly identify any performance issue impacting users.
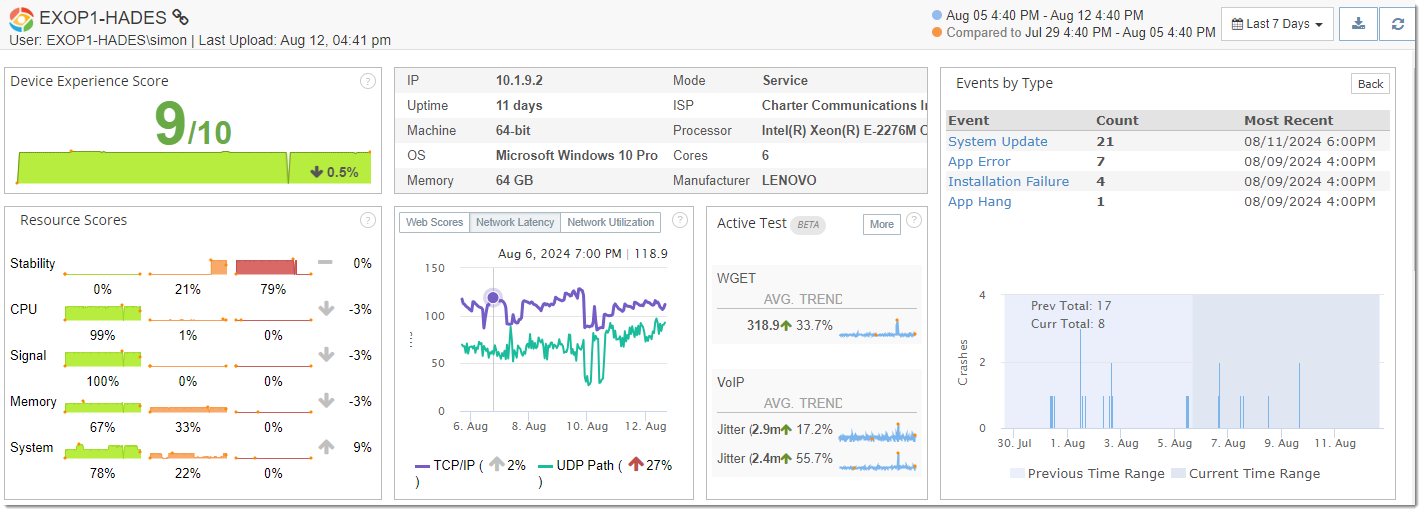
The collection of metrics from Service Watch provide engineers with the right information to quickly pinpoint – or rule out – the root cause of performance degradation. Troubleshooting becomes significantly more effective by following a straightforward process. First, engineers can rule out the device and application resources. Next, they assess the network and ISP to identify potential bottlenecks. Finally, the network telemetry of applications, focusing on response times, jitter, and packet loss, helps zero in on application connectivity issues. This streamlines the resolution and ensures that issues are addressed effectively.
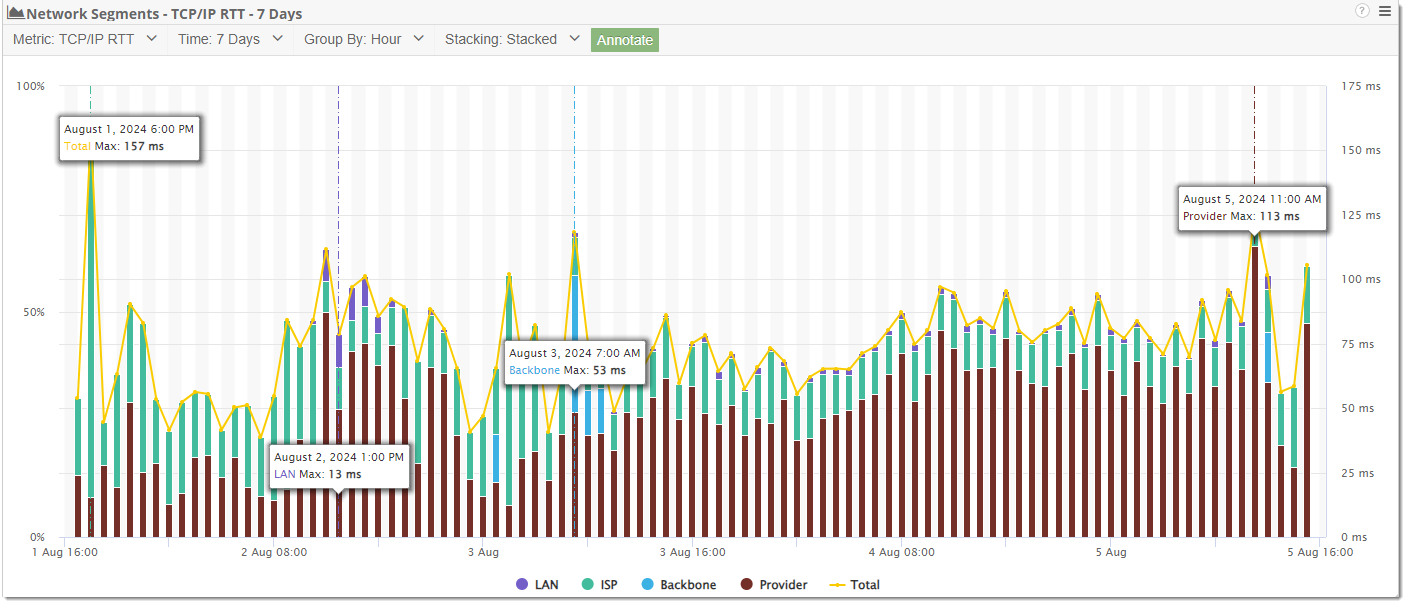
VoIP and Bandwidth are both subject to performance degradation, especially when the ISP performs poorly. Gaining this visibility alone will quickly point out which ISPs are performing better. Also, with the Network Segment views provided both in the dashboards and from the device information, figuring out the cause of application slowdowns has never been easier.

Taking things one step further, Service Watch Browser can be deployed alongside Service Watch. Service Watch Browser, an extension for Google Chrome and Microsoft Edge, collects the load times and errors experienced when accessing the configuration-specified pages. When dealing with bandwidth testing, we’ve seen customers utilize Service Watch Browser with auto-refreshes to continually test the performance of a resource or for degradation during streaming pages such as YouTube.
Another valuable feature for identifying network performance issues is Service Watch Active Test. These lightweight network tests, focus on critical areas like DNS, VoIP, ping, and web get to pinpoint slowdowns. When these active tests detect fluctuations, they quickly highlight performance degradation.
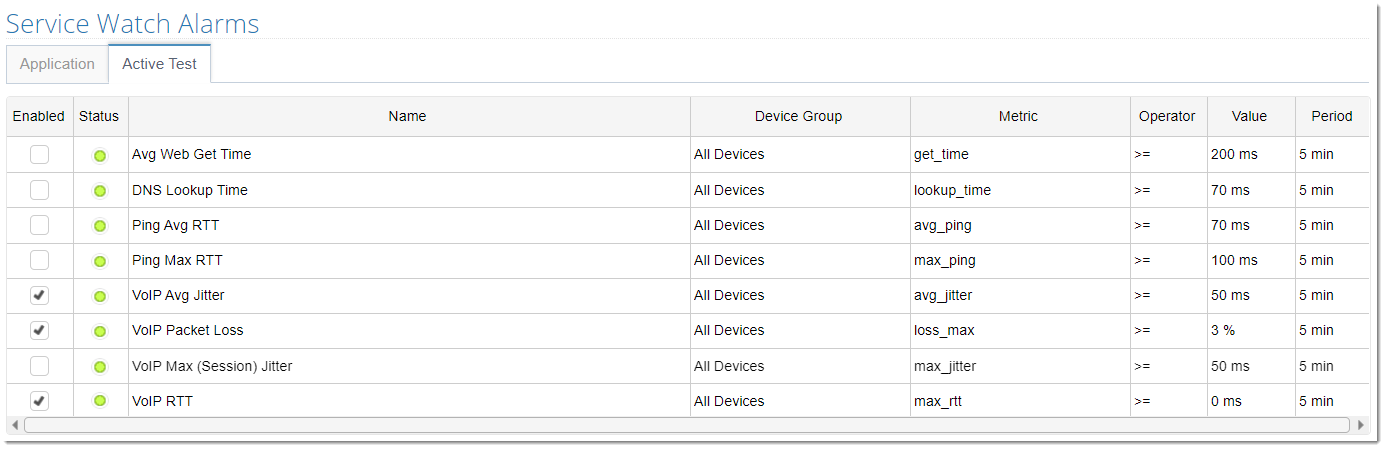
Our customers have even shared that utilizing the VoIP active test has been particularly effective at quickly identifying drops in performance to specified receivers. Since this testing is from the end-user device, proactively communicating to a user that their experience may be impacted is possible. This level of insight helps teams address issues promptly, while also allowing the end user to plan their work accordingly.
By deploying Service Watch into your monitoring strategy, you aren’t just gaining visibility into the network performance, you’re ensuring a reliable and consistent experience everywhere, for every user.
Advantages of Exoprise Monitoring
In conclusion, monitoring VoIP and bandwidth is made incredibly simple with Exoprise’ CloudReady and Service Watch solutions. Whether organizations are looking to proactively monitor your network or plan for a digital transformation, Exoprise has you covered..
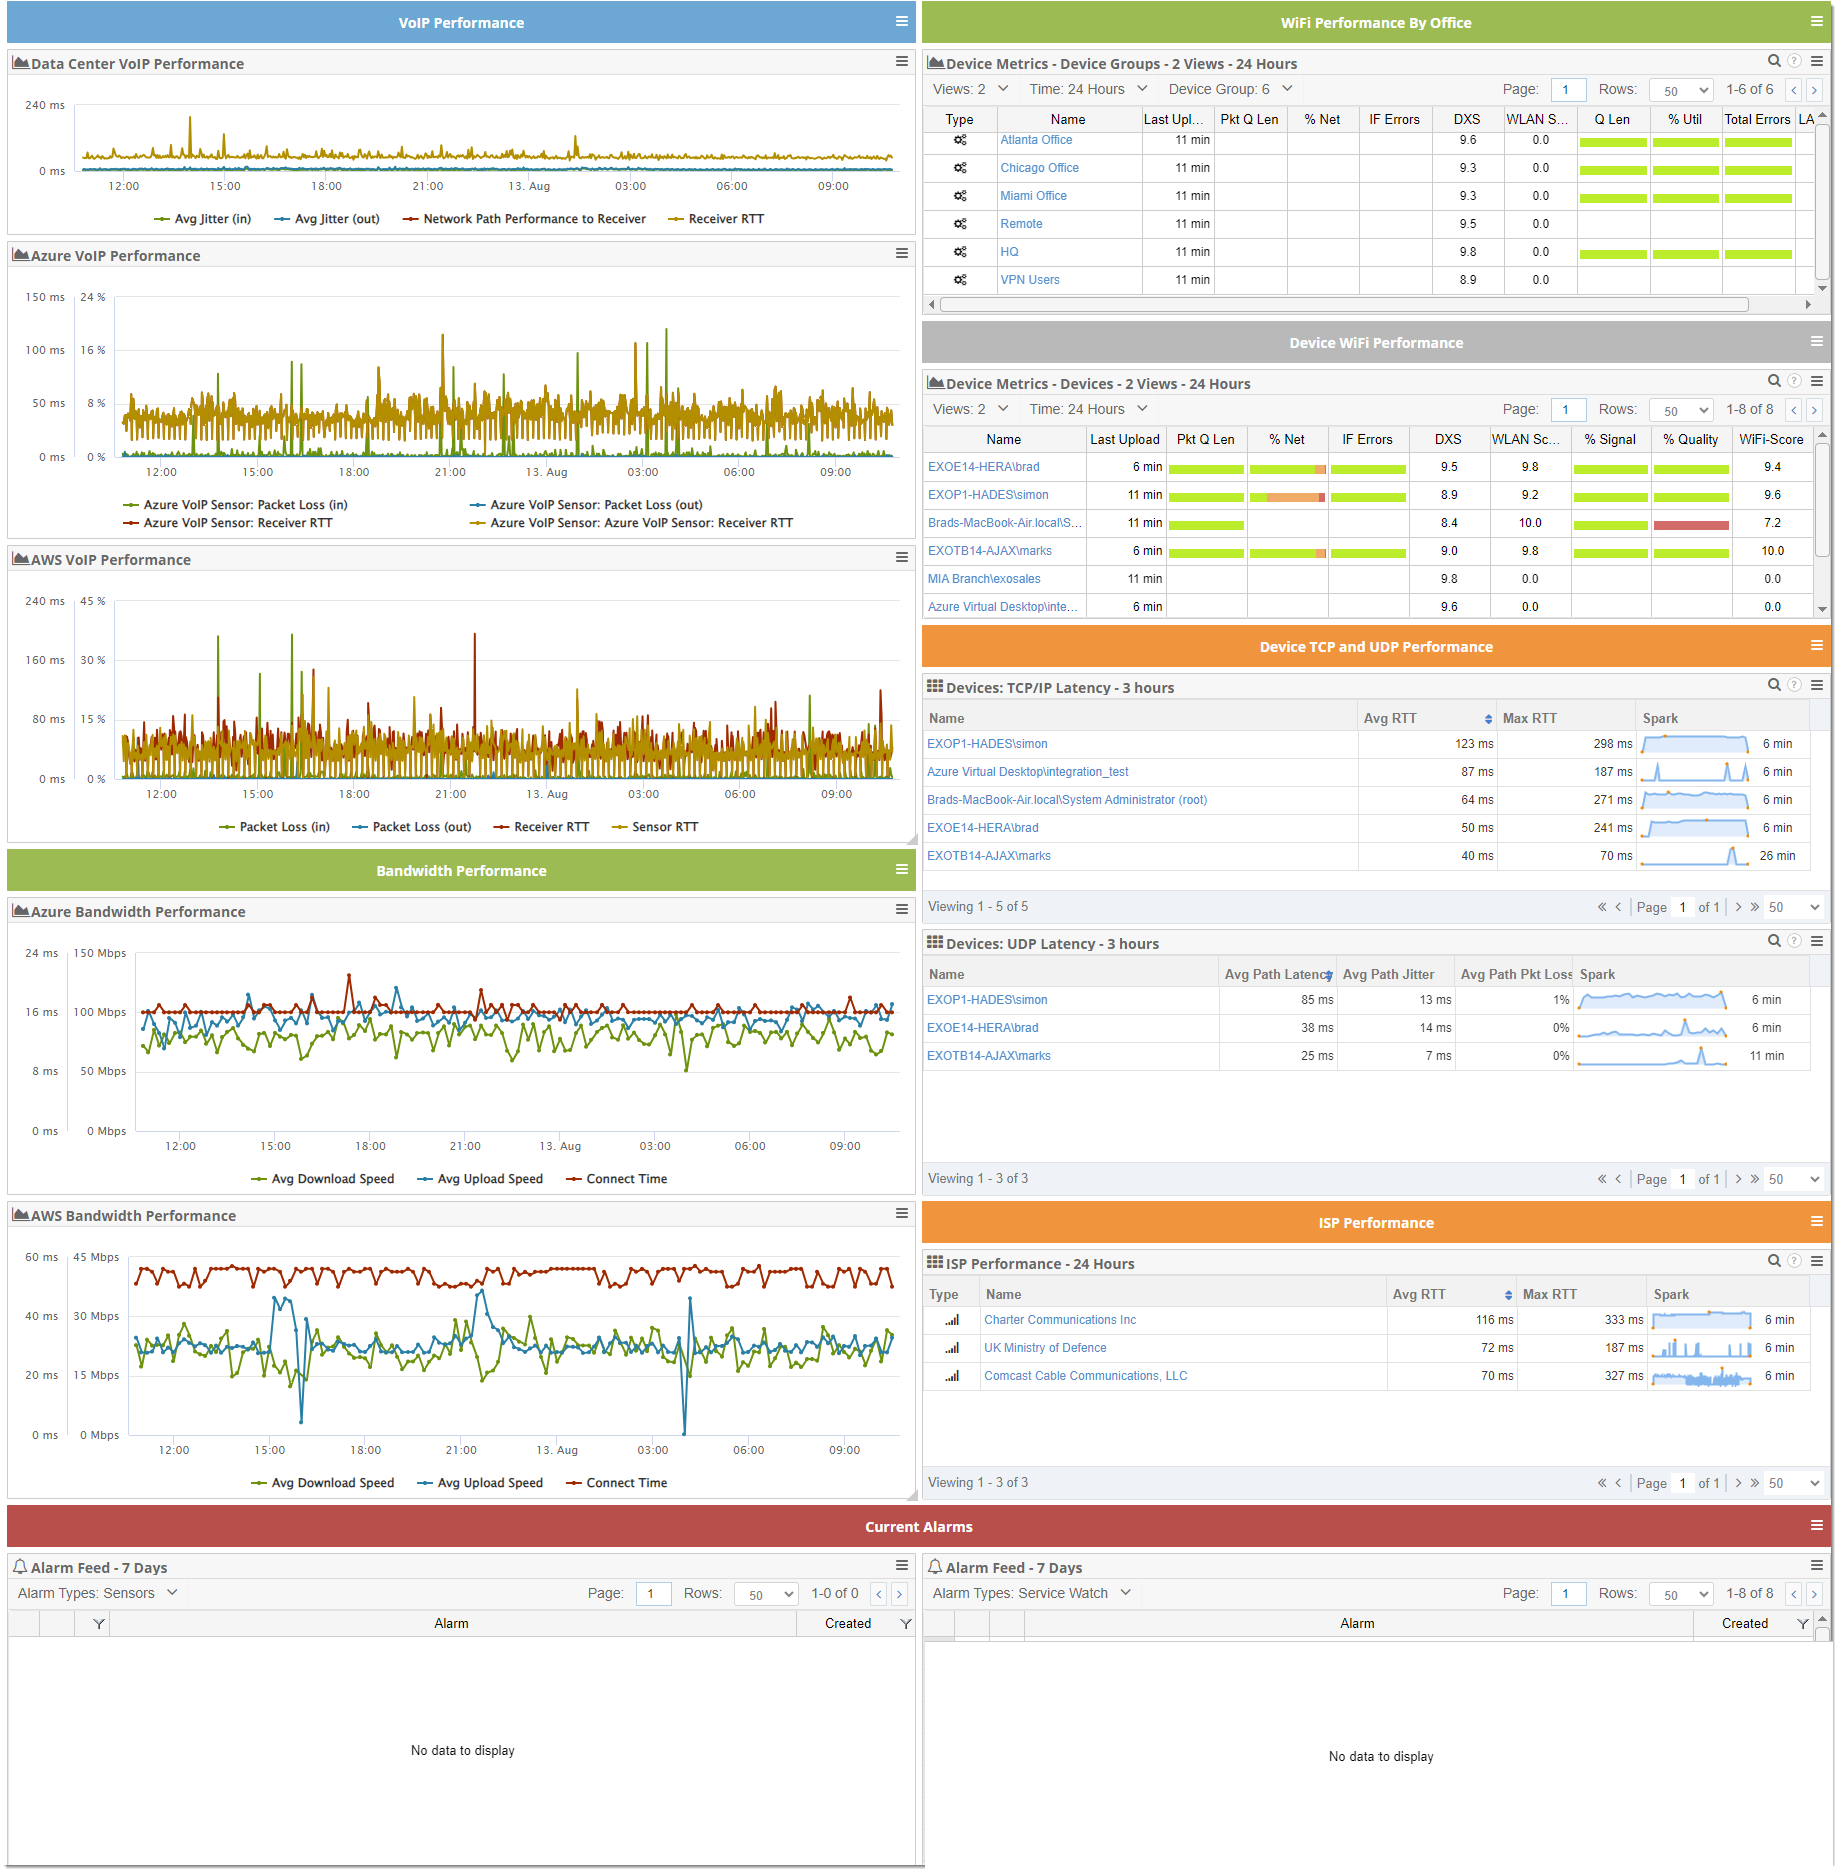
With a full deployment of Exoprise, organizations benefit from proactive notifications through the intelligent Service Watch and CloudReady alarms. Plus, the ability to visualize the collected metrics with customizable dashboards offers an easy-to-understand view of your entire network and devices – in a single pane of glass. Want to experience the difference? Start a trial and see for yourself.
Related Posts


