With the digital landscape today, maintaining seamless connectivity is a priority for most organizations. However,…
With every webpage loaded, email sent, or video streamed, network traffic takes a complex journey across multiple infrastructure nodes. From the device to the destination, data packets travel across various gateways, networks, through routers, switches, and service providers along the way.
Understanding the network traffic paths and segments along the journey reveals much about performance, latency, congestion, and possibly even bottlenecks. In this article, we’ll delve into the interconnected, intricate routes, network traffic takes. We’ll also investigate the key components involved and how other technologies such as SD-WAN and ISPs shape the user’s digital experience.
For a deeper dive into this topic or to answer any of your questions, we encourage you to also read this article, Improve End-to-End Visibility with Network Segment Analysis for a deep dive into the latest Exoprise features.
Why Understanding Network Traffic Matters
Understanding how network traffic works in today’s increasingly connected digital world is crucial. Whether as an IT professional, business owner, or just a regular internet user, this knowledge provides several key benefits.
Optimizing and diagnosing network performance becomes increasingly complicated the less you know about network traffic. By understanding how data travels between networks, engineers can identify bottlenecks, reduce troubleshooting time, or implement Quality of Service (QoS) to improve performance.
By understanding normal, healthy traffic patterns, it is much easier to identify anomalies. This is important as these anomalies can directly relate to security issues. Regarding security, not understanding the traffic of an application can lead to improperly configured firewalls, encryptions, or other security measures.
Understanding traffic is also important when implementing new technologies. Optimizing cloud applications and ensuring low latency and high availability is essential to the user experience. With businesses relying more on SD-WAN, VPNs, or cloud-based proxy solutions, understanding traffic flow is essential when configuring multiple WAN connections.
Lastly, which we hinted at above, is the end-user experience. Users impacted by network performance problems tend to lose faith in their IT teams and suffer lower productivity. Understanding the flow of traffic allows engineers to effectively design and plan their network transformations and prevent user frustration from outages and poor performance.
Basics of Network Traffic Flow
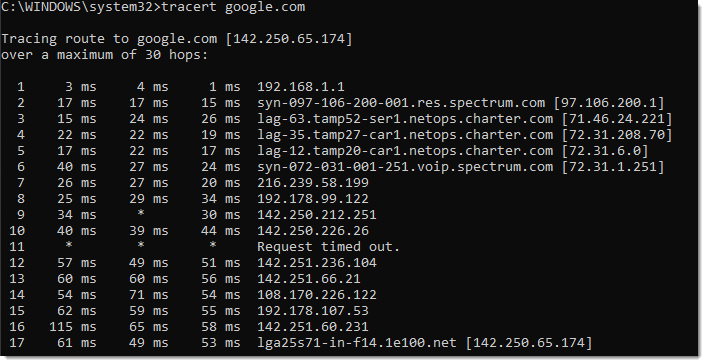
How traffic flows from a device to destination, often through a service provider’s network for applications, involves critical steps and components. These network flows guide data packets to their destination (service provider network or internet) from their source (your device). The breakdown of components typically involved in traffic flow include:
The Source Device: Origin of a data request which is usually TCP/IP or UDP-based data packets
 Local Area Network (LAN)
Data packets from the source are forwarded through the router or switch, eventually reaching the firewall which may inspect the packets for security rules

Internet Service Provider (ISP)
The first network interacted with upon leaving your internal network. ISPs utilize DNS to ensure data packets reach the specific domain or website
 Wide Area Network (WAN) / Backbone
Data leaving your ISPs networks is forwarded through a backbone, which are large peering networks that connect ISPs and provider network data centers around the world. These high-performance networks deliver data to provider networks
![]() Provider Networks
Provider Networks
The destination of the sent packet, typically correlates with the infrastructure of an application, such as Microsoft or Google’s infrastructures. Provider networks must be high-performing and highly available to ensure uptime and an optimal user experience
Impacts of Network Issues
Not properly managing and maintaining networks can cause outages and poor performance but unplanned outages, such as an ISP outage can be equally impactful. When an end-user is unable to accomplish their daily tasks, it costs money – lots of money.
The cost of an outage has exponentially increased over the years, most large organizations have said that an hour-long outage can reach a cost of more than $300,000. Although certain outages fall outside what engineers can control, this is not always the case.
An example of this would be a bad router configuration being applied over the weekend, causing users network issues when they return to the office. Even though it was an intentional change with unintended consequences, it can be expensive and happens frequently enough.
To make matters worse, there isn’t only a financial cost associated with these network issues. They can also negatively impact reputation, customer confidence, innovation, SEO scores to name a few.
How Exoprise Can Help
With how expensive network issues can get, having an understanding of how traffic flows is beneficial, however having a powerful monitoring solution makes the world of difference. We recently released Network Segment Analysis, a new feature for both Service Watch and CloudReady.
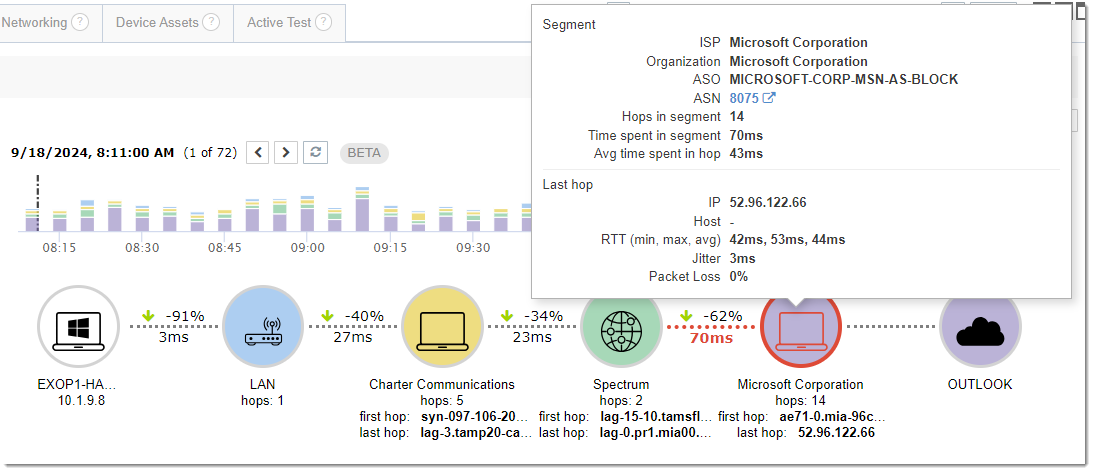
Network Segment Analysis captures the path network traffic takes to reach its destination while aggregating network segments utilized and shining light on problematic network owners within the pat. With Network Segment Analysis data, engineers have the necessary data available to begin diagnosing. Segment analysis enables comparing historical and crowd-based groupings to immediately detect anomalous slowdowns and deviations in network path performance. Without Exoprise’s new segment analysis, network administrators would have to spend lots of time doing hop-by-hop math and examining the round-trip-time of individual network nodes instead of quickly identifying the ASN, ASO, and network owner responsible for a problem.
Through Service Watch, engineers can review the device and application performance to ensure there are no culprits and move into the network visibility from there. By identifying where the slowdown begins to occur across the network, engineers can move forward with troubleshooting the correct source of the issue.
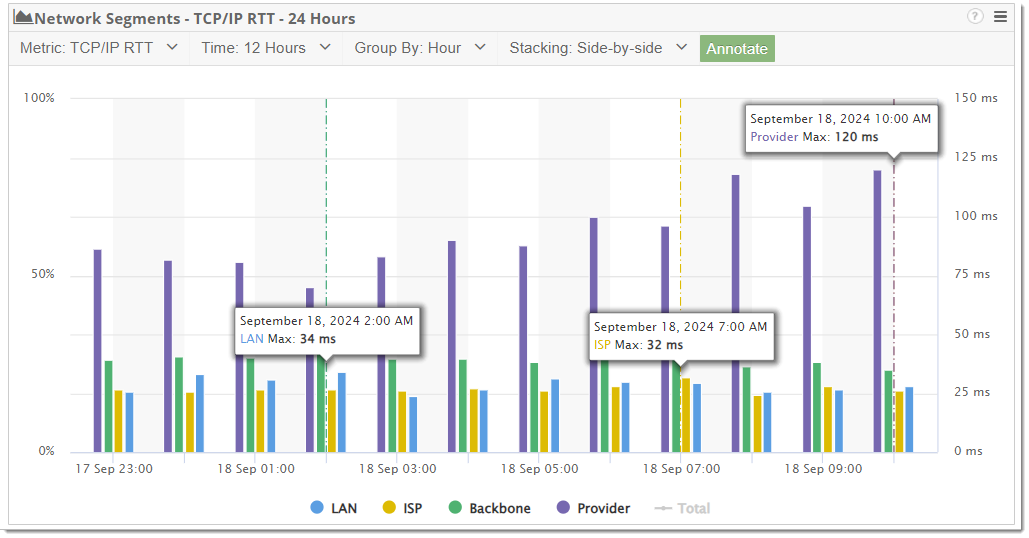
Along with Network Segment Analysis also comes new widgets allowing enhanced visibility and easy comparisons for baselining your end-user devices and their network performance. The Network Segment Graph widget can be filtered to show only the specific network segment type interacted with to easily determine if it is problematic.
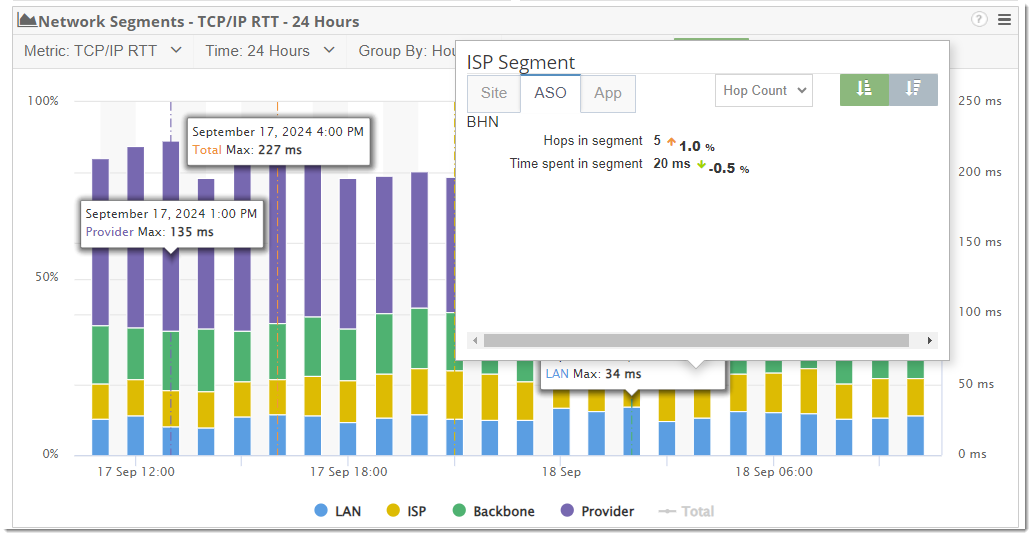
Additionally, filters can be configured to show all the segments performance side by side to easily compare the LAN, ISP, Backbone, and provider network segments. Clicking into the segments from the graph will also provide you with additional, more granular details.
We’ve also added Network Segment Analysis to CloudReady synthetics, enhancing the Network Path Performance. Earlier we mentioned the example of an outage due to a misconfiguration, CloudReady would have detected this anomaly and raised the alarm.
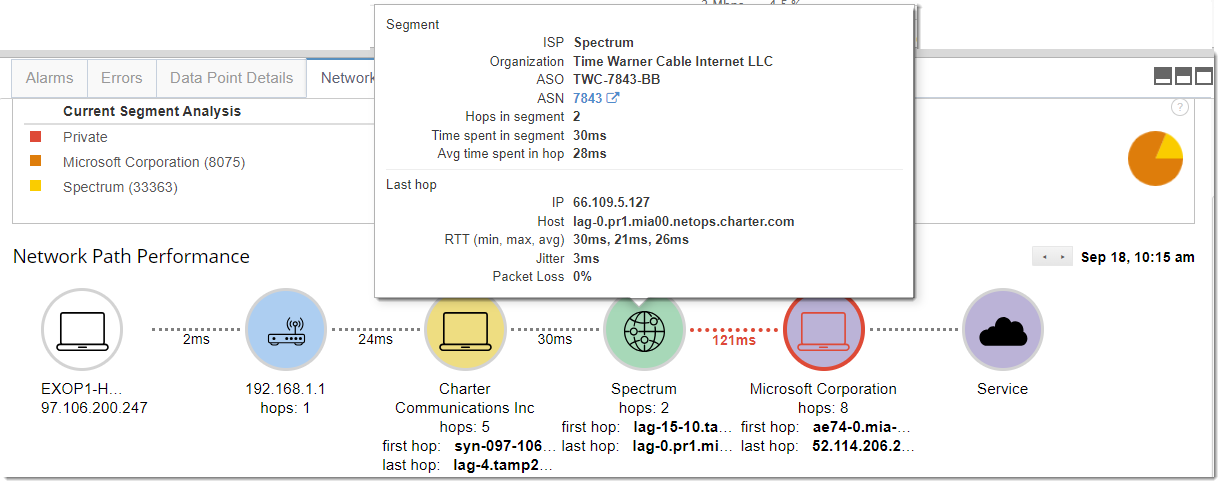
In this scenario, not only would a proactive notification have been sent out, but the engineer investigating the issue could quickly identify the cause. By reviewing the alarm, they can identify where to start looking and if the issue is network-related, Network Segment Analysis data would help them pinpoint exactly which networks the performance begins feeling the impact.
Call to Action
Having an understanding of network traffic flow is crucial for optimizing performance and troubleshooting potential issues. By mastering the paths that data packets take – through routers, switches, ISPs, or SD-WAN technologies – improving your network’s efficiency and reliability becomes much less of a lift.
To continue building on what you’ve learned, ask any questions about the product or features, we invite you to join our upcoming webinar. It’s a great opportunity to learn more and explore the new Network Segment Analysis feature.
Additionally, to start putting these insights into practice, sign up for a Free Trial and see firsthand how Exoprise helps.
Related Posts