With every webpage loaded, email sent, or video streamed, network traffic takes a complex journey…
With the digital landscape today, maintaining seamless connectivity is a priority for most organizations. However, Internet Service Providers (ISPs), the Internet, and Software-Defined Wide Area Network (SDWAN) performance issues can severely impact operations, frustrate end-users, and can be costly when downtime occurs.
Having recognized these challenges organizations face, we are excited to introduce our newest product feature, Network Segment Analysis, a powerful tool designed to provide detailed views of connections and the network hops they traverse established by applications to their infrastructure. Available for both Service Watch’s Connected (TCP/IP) and Streamed (UDP) networking, as well as CloudReady Synthetics, our real-time Network Segment Analysis helps quickly pinpoint the culprit when it comes to application latency, packet loss, slowdowns, and outages.
This powerful addition to the Exoprise product suite detects performance bottlenecks and speeds up root-cause analysis and diagnostics. With the available metrics in Network Segment Analysis, IT teams can quickly and efficiently resolve issues no matter if an employee is working in the HQ, branch, or working from home. Segmenting network connectivity and traces enables quick comparisons, alarming, diagnostics, and crowdsourcing. Say goodbye to guesswork and hello to a proactive network management solution with Exoprise.
What is Network Segment Analysis?
Network Segment Analysis provides a detailed view into the connectivity and packet traversal of core applications to their utilized infrastructure such as Teams relays during a conference call or Zoom inbound and outbound packet flow to the Zoom data centers (AWS regions). Identifying the slowest network segments for core, business-critical, applications has never been possible before.
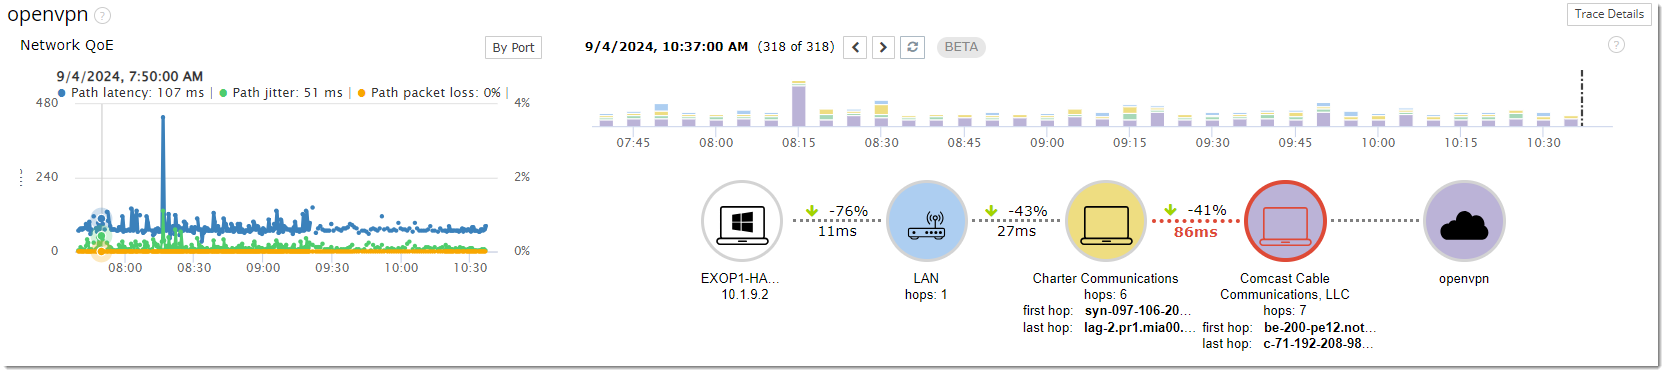
When determining network segments, Exoprise examines and groups Autonomous System Numbers (ASNs) that interact with each other, along with their timings and edge conditions. The connecting dotted lines between each segment aren’t just visual aids; they reveal timings and trends, which provide exceptional insights into network performance. The numbers above the dotted lines refer to the trend of the segment over the specified period you are viewing. The timings visible under the line, on the other hand, refer to the total round-trip time taken from each segment for the packet traversal test at the time. Click the image for a larger view.
The bar graph above the icons represents the time spent in each of the network segments over the selected time period. For each core application, Service Watch monitors the send and receive traffic to identify the most used destinations – even if they change as the application is communicating. Every 15–30 seconds, the network segments are analyzed for performance to pinpoint any potential slowdowns. And Exoprise Service Watch does it without impacting the applications, system, or network.
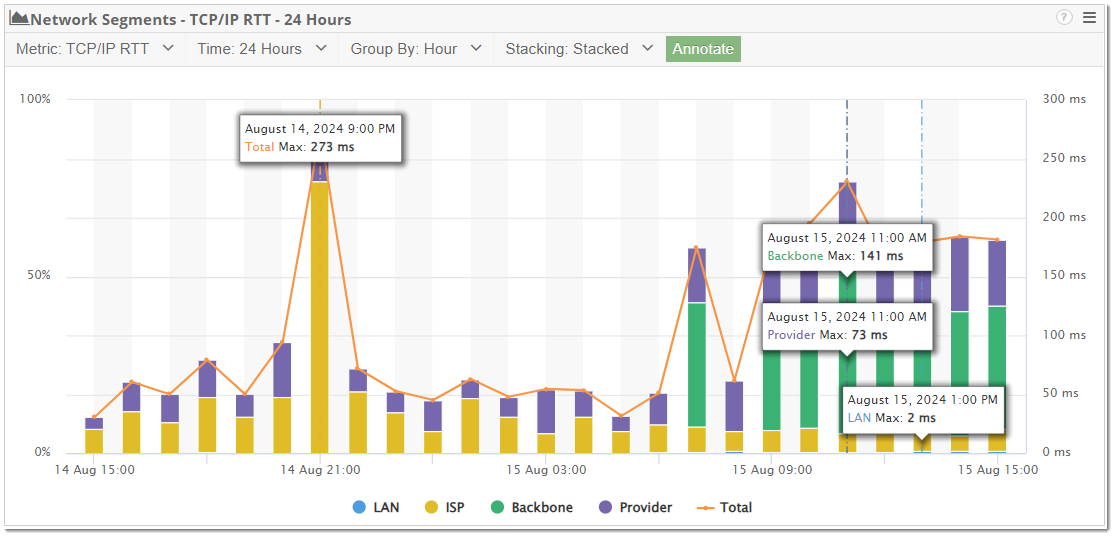
Double-click a trend or icon for further investigation into the ASN or network owner and drill into excessive slow-downs. Exoprise aggregates time spent in each network segment by round-trip time spent in the LAN, Gateways, ISPs, Backbones, and Provider Networks. When viewing Network Segmentation Analysis data, your team can rule out each of the problematic networks within seconds, ensuring applications are up and running at optimal performance.
Understanding Network Segments
To help with understanding the segments and what they represent, we have broken down a detailed description of the network segments we record, parse, and analyze:
- LAN
Local Area Network or LAN hops represent the time taken in the internal network before reaching the ISP. As the first hop in the journey, it’s critical to diagnose issues that originate from within your infrastructure. Often times, these LAN hops can be impacted by Wi-Fi access or slow home routers. - ISP
The Internet Service Provider segments used for application communications, these are typically the first network segment after the gateway and are responsible for how someone’s computer connects to the Internet. Monitoring ISP segments isolates poorly performing ISPs that are often the culprit during video and audio calls. - Backbone
This represents the high-performance, interconnected networks, and core routers which connect multiple subnetworks. This allows data to be exchanged across the Internet. Most traffic on the way to its destination (i.e. Microsoft, AWS, Zoom or Azure) experiences some latency and variability (jitter) during the traversal. It is necessary to understand performance and latency issues when data travels through the internet’s core infrastructure. - Provider Network
Finally, network segments utilized by SaaS and applications providers and examined. They’re typically the final hops for applications. For example, this would include Microsoft’s Teams infrastructure. Monitoring the provider segments allows teams to quickly identify any delays or issues.
An understanding of the Network Segment Analysis and the segment roles is crucial for effectively optimizing network performance and reducing mean time to resolution (MTTR) when an issue presents itself.
Simplify Network Performance Benchmarking
Along with Network Segment Analysis for Service Watch and CloudReady, we released new widgets and dashboards that different IT teams can configure to show connected and streaming ISP and network segment performance for specific applications and device groups. These visualizations are a “game-changer” as it allows engineers to quickly identify if and where multiple users are negatively impacted by poor application network performance and which segment and network owner is responsible.
Once configured, the widget also allows you to adjust the visualization based on both preference and functionality. For example, while attempting to understand how ISPs are affecting an application, the filters at the bottom can limit the graphed data to focus exclusively on ISP-related data. Additionally, selecting one of the segments will provide additional details providing more granular insights into the device, ASO, and application.
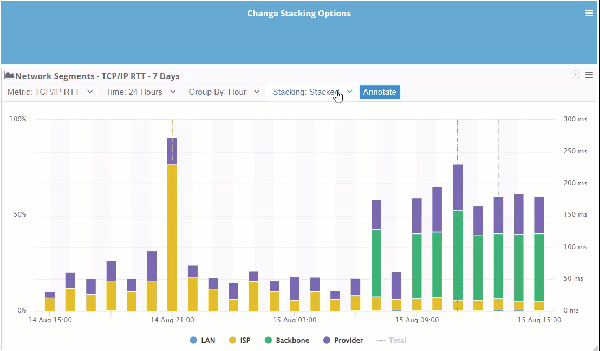
Alternatively, if your team needs to find the slowest network segments, the bars can be set side-by-side to pinpoint where the telemetry is lagging.
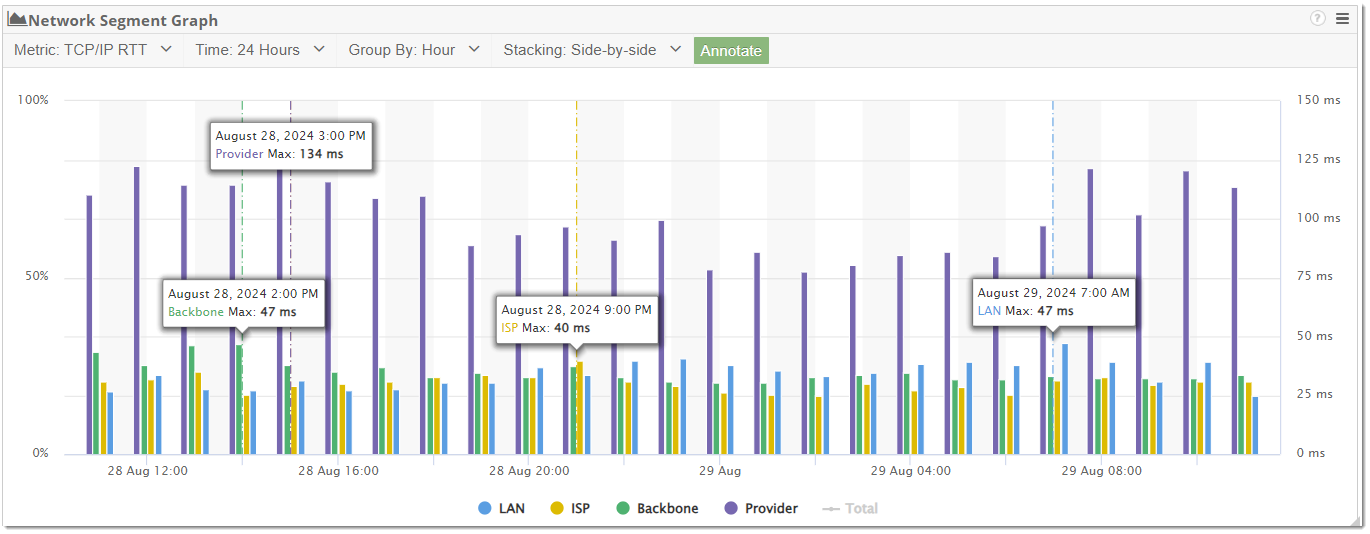
While interacting with the widget, the ability to switch between TCP/IP and UDP and change the displayed time range. There is also the option to change how the segments are grouped by time.
With the combination of these toggles and filters, this powerful feature provides engineers with the granularity they need to spot fluctuations, performance degradation, or clearly understand network behavior over a period of time.
Network Segment Analysis for CloudReady
We’ve taken the power of Network Segment Analysis and integrated it into the CloudReady Synthetics Network Path Performance. Implementing this functionality within CloudReady enhances the visibility into slow networks that the proactive senors utilize. This added functionality improves your team’s ability to pinpoint network-related issues proactively before they impact end-users and the business.
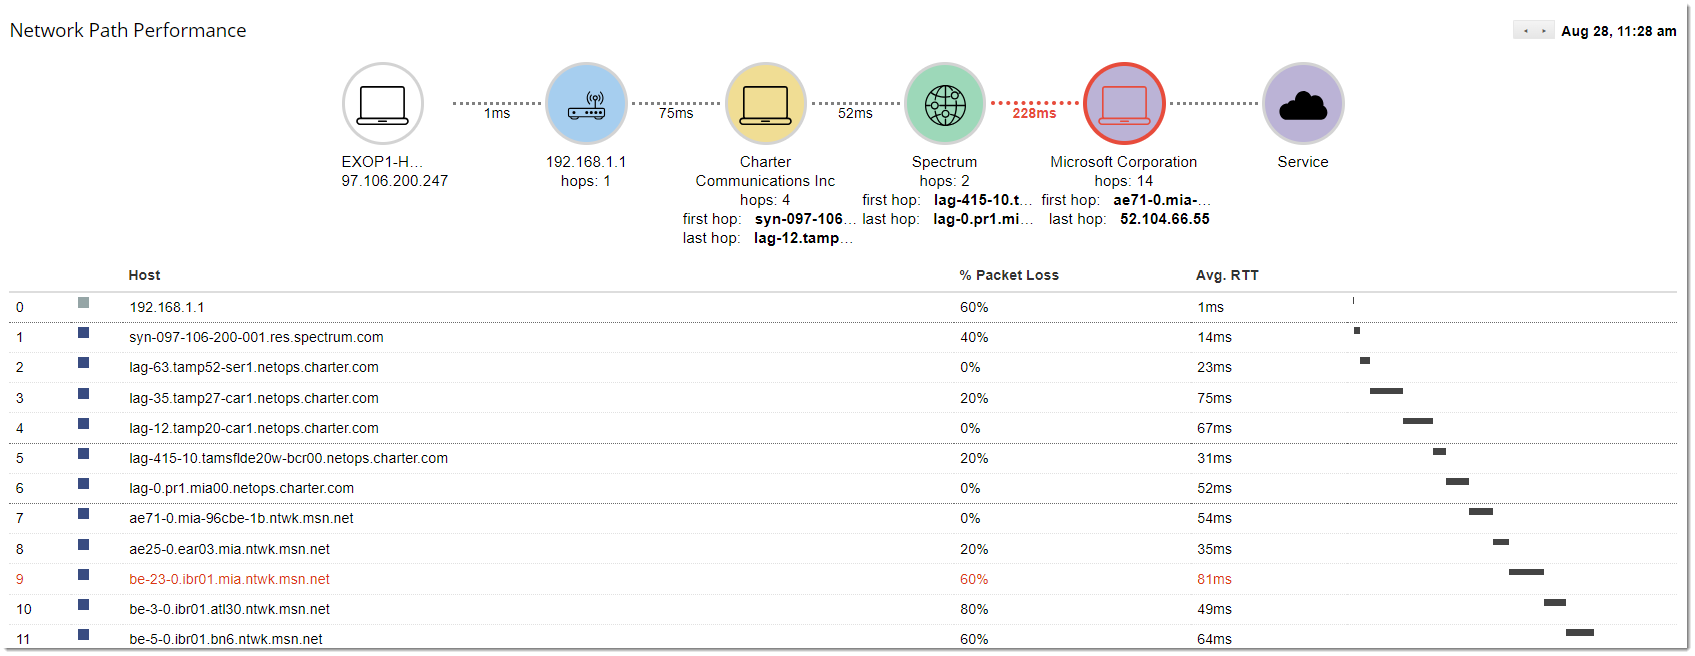
When a sensor begins experiencing an issue, an alarm is generated notifying the involved parties of performance degradation, outage, or continuous errors. Once an engineer begins troubleshooting, reviewing the CloudReady sensor that triggered the alarm is the typical starting point for troubleshooting. After reviewing the affected sensor, if the issue relates to network performance, the Network Segment Analysis is your go-to tool to identify where the responsibility lies within the network path.
With these networks being aggregated into segments– LAN, ISP, Backbone, and Software as a Service (SaaS) providers networks – engineers can quickly narrow down the root cause. In doing so, they can achieve faster resolution times knowing exactly where to point the finger, rather than spending additional time and resources manually running traces repeatedly. CloudReady does the heavy lifting, allowing your team to focus on resolving issues efficiently. The Network Segment Analysis makes an engineer’s life easier.
Utilizing The Network Segment Analysis
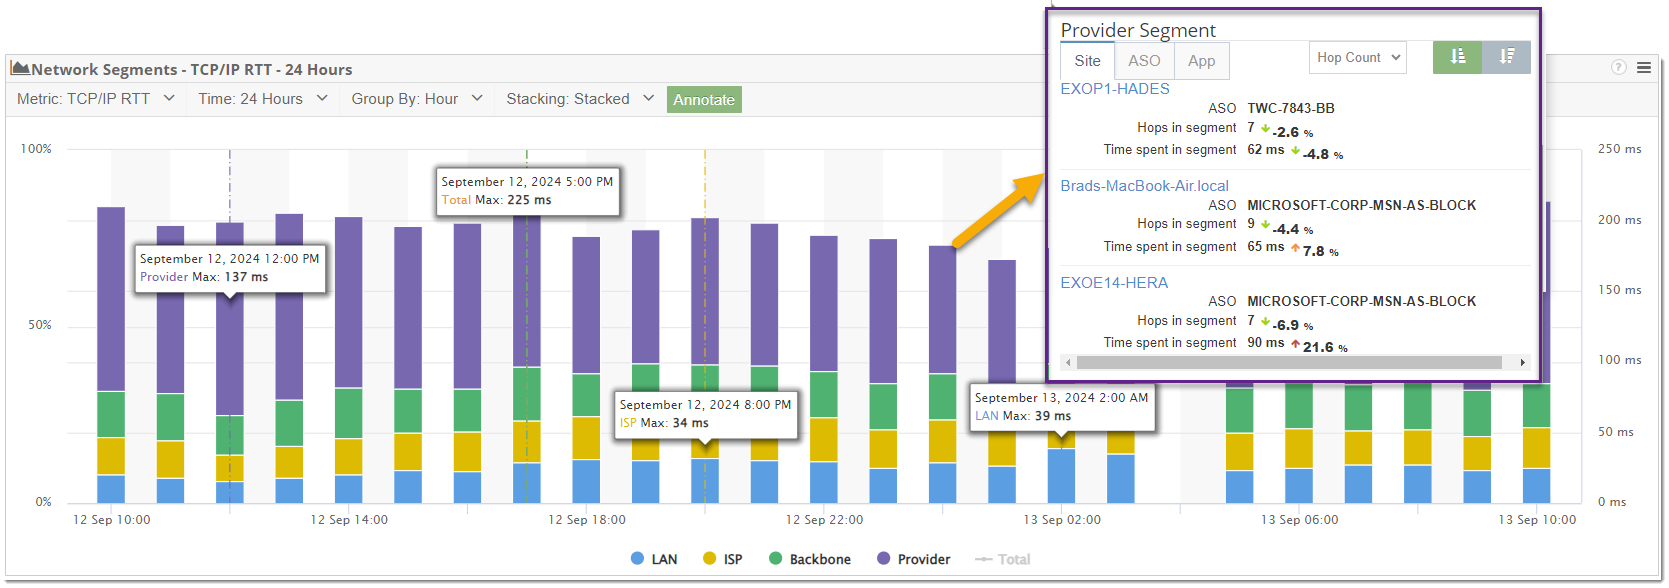
For more details into each network segment, click the representative icon to reveal a detailed card. These details include important information such as the ISP, Organization, Address Supporting Organization (ASO), Autonomous System Numbers (ASN), number of hops, and more.
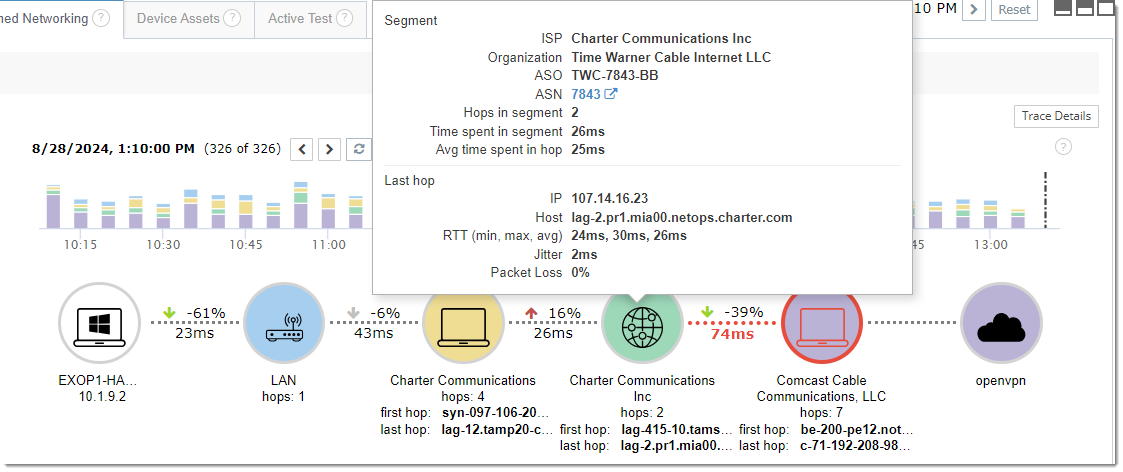
This level of detail being collected is invaluable when trying to optimize network performance. Having the ISP, ASO, and ASN aggregated into segments – alongside the first and last hop details – under the segments is a dream come true for network engineers tasked with implementing or improving a SaaS solution.
Rather than having engineers spend their time gathering this information, identifying the routes, ASN’s, calculating time spent in, etc., the metrics are collected each sensor run, with a frequency of 1-5 minutes. With these data points available, making improvements is simplified, and if a change negatively impacts the performance, DON’T WORRY, the Exoprise Alarms will let you know within minutes.
Conclusion
In conclusion, the integration of the Network Segment Analysis to Service Watch and CloudReady equip your teams with the critical insights to improve Mean Time to Resolution (MTTR) by eliminating guesswork and providing them with the real metrics they need to accomplish their tasks.
With the enhanced visibility provided by the new Network Segment widget, coupled with the proactive notification for performance degradation and outages, network teams can confidently plan and execute their network transformation, SD-WAN deployments, or any necessary improvements. Still skeptical? Take out a Free Trial and see the difference for yourself.
Related Posts