Build Dashboards That Combine Synthetics and Real User Monitoring
Watch this video and see how to combine data from proactive synthetic monitoring that runs 24×7 with Exoprise Service Watch Desktop data that’s deployed to every user. Diagnose cloud service, unified communications, and Microsoft 365 issues in simple steps with baseline and real-time data from end-user devices.
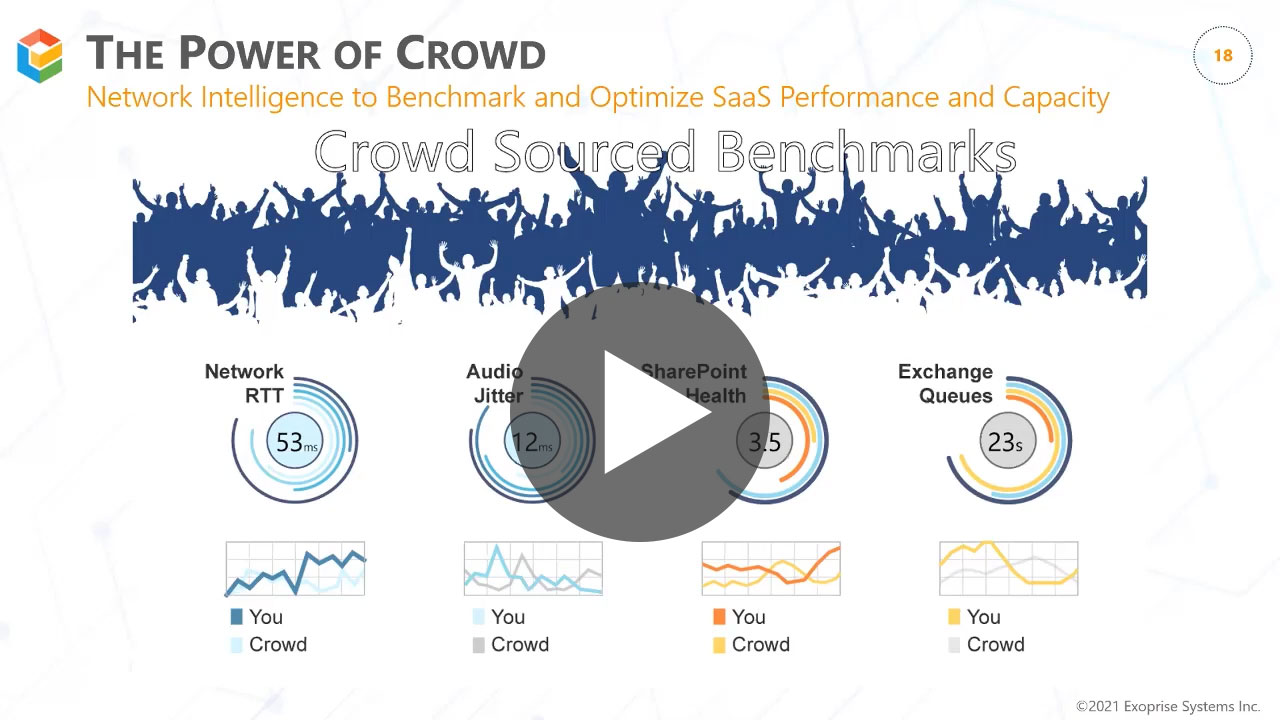
Benchmark SaaS application and network performance through the power of crowd intelligence. Reduce MTTR and accelerate troubleshooting during outages by instantly finding bottlenecks and outages in the service delivery chain.
Watch this video to learn how to use the Service Watch Browser to monitor SaaS applications with real user monitoring. Get detailed page diagnostics and troubleshoot local network connectivity issues.
See how Exoprise helps you optimize your Software-as-a-Service Apps and their networks today
Build dashboards with custom Device Group data to quickly see metrics across 1000's of machines
Watch this video to see how to configure and utilize Service Watch Active Test, the perfect combination of lightweight synthetics and real-user monitoring
Device Groups enable aggregating metrics across 10's of 1000's of devices for rapid viewing, alarming, and visualizations
Watch this video to see the benefits of Service Watch Desktop for macOS, how to configure and install it along with Service Watch Active Test
Watch this tutorial to see how to troubleshoot slow Microsoft Outlook issues or Exchange Online performance.
