macOS Digital Experience Monitoring
Challenges in Monitoring macOS Digital Experiences
Monitoring Apple macOS digital experiences across desktops and laptops requires recording performance, security, and other relevant metrics from the device, often for a remote worker or personally owned computer. Supporting these macOS enterprise users can be challenging for IT organizations when the tools and expertise doesn’t exist for macOS devices as much as they do for the Microsoft Windows platform.
Limitations in Network and Performance Monitoring
While macOS provides some tools for performance and network monitoring, there are limitations that make it difficult to capture the employee digital experience
Best of Both Worlds for macOS Digital Experience Monitoring

Service Watch Real-User Monitoring and CloudReady Synthetics
The Exoprise DEM platform for macOS uniquely supports a combination of Service Watch Real-user Monitoring and CloudReady synthetics in one solution. This includes monitoring the performance of the device, the OS, the apps, and the network.
Diagnose UCaaS, VoIP, and Collaboration Apps
Diagnosing networked UCaaS apps like Microsoft Teams, Outlook, and Zoom along with mission-critical business office suites like Microsoft 365, Google Apps, or Salesforce is critical when employees work from home or Bring Their Own Devices (BYOD) on the macOS platform.


Complete Network DEM / DEX for macOS
Diagnosing applications, system resources, or enterprise browser access ensures a smooth and productive experience for macOS users. Troubleshooting 3rd-party SaaS, Web and thick client macOS applications is critical to enterprise collaboration and productivity. Previously, this kind of DEM/DEX diagnosis wasn’t possible before on the macOS platform.
Digital Experience Monitoring for macOS Video
Watch this tutorial for an overview of Service Watch Digital Experience Monitoring for macOS
macOS Real User Monitoring
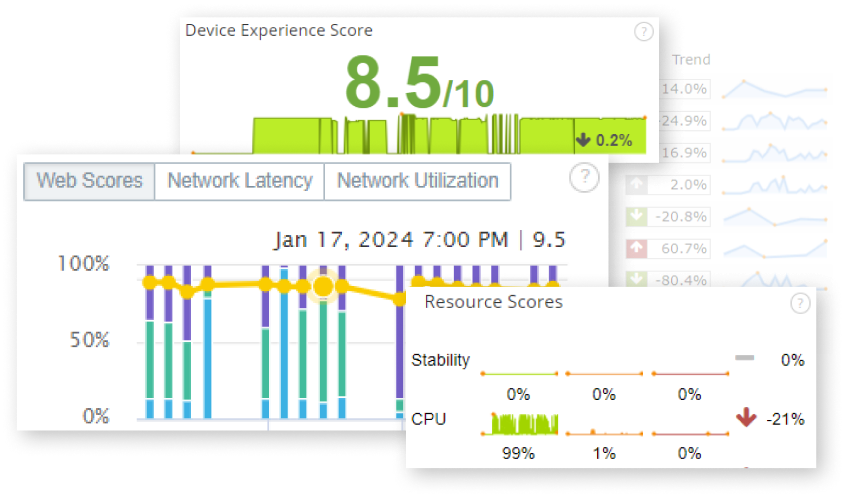
Collect Thousands of Metrics
Service Watch for macOS monitors the intersection of business & communications apps and the dependent network, Wi-Fi access points or gateways from the macOS device and end-user perspective. Once deployed, Service Watch collects thousands of metrics used to diagnose and troubleshoot the employee experience.
Deep Network Visibility for macOS
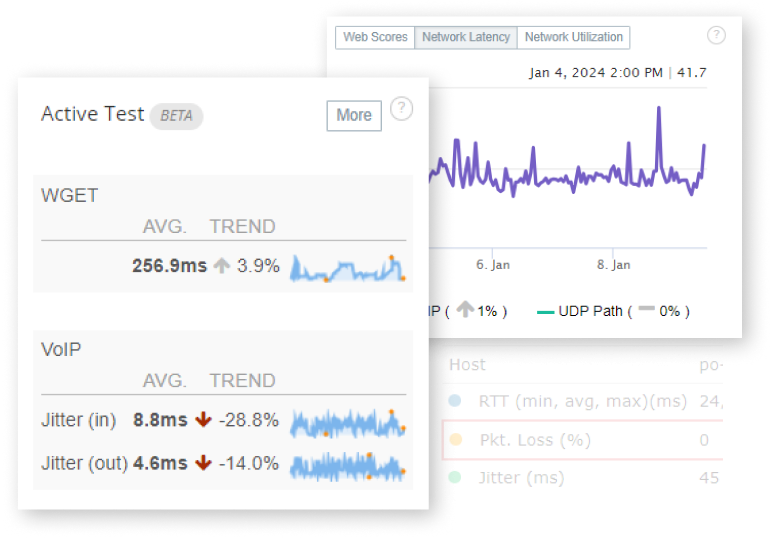
On top of the typical resource metrics (CPU, disk, memory, etc.) Service Watch offers complete network visibility into the TCP/IP and UDP network traffic for core applications. Combined with synthetics and Service Watch Active Test, this visibility is complete coverage and proactive monitoring in one solution, no matter where employees work.
Monitoring SaaS Apps from the macOS Users Perspective
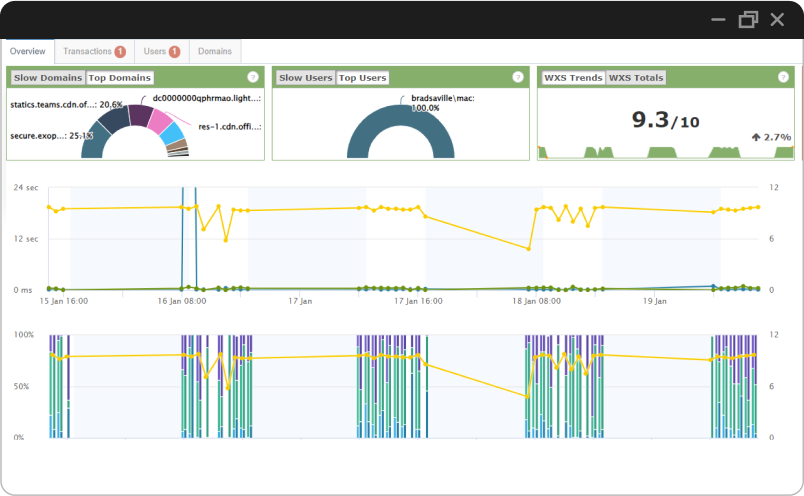
Diagnose slow SaaS, custom, or in-house Web-based applications with Service Watch and Service Watch Browser. Pinpoint the app, network ISP, proxies or SASE solution that’s slowing access and limiting productivity. Reduce Mean-Time-To-Resolution (MTTR) when end users report issues and hold SaaS vendors accountable for their SLAs.
Instrumented from the end-user devices, Service Watch pinpoints the slow culprit in the service delivery chain or network path. Application owners – even if they’re not developers – get a perspective of the overall device experience.
Synthetic Monitoring for macOS
CloudReady Synthetic monitoring simulates end-user interactions with business-critical applications or websites to proactively monitor their performance. Synthetic monitoring identifies potential issues before users being affected and runs 24/7. With CloudReady synthetic monitoring, complex SaaS applications are continuously tested.
Don't spend time maintaining custom scripts for web or SaaS apps
CloudReady synthetics monitor any web-based app for high-level timings and low-level network analytics to diagnose quickly. Automated alarms raise incidents for tickets and ServiceNow integration.
Service Watch Active Test for Continuous Network Tests
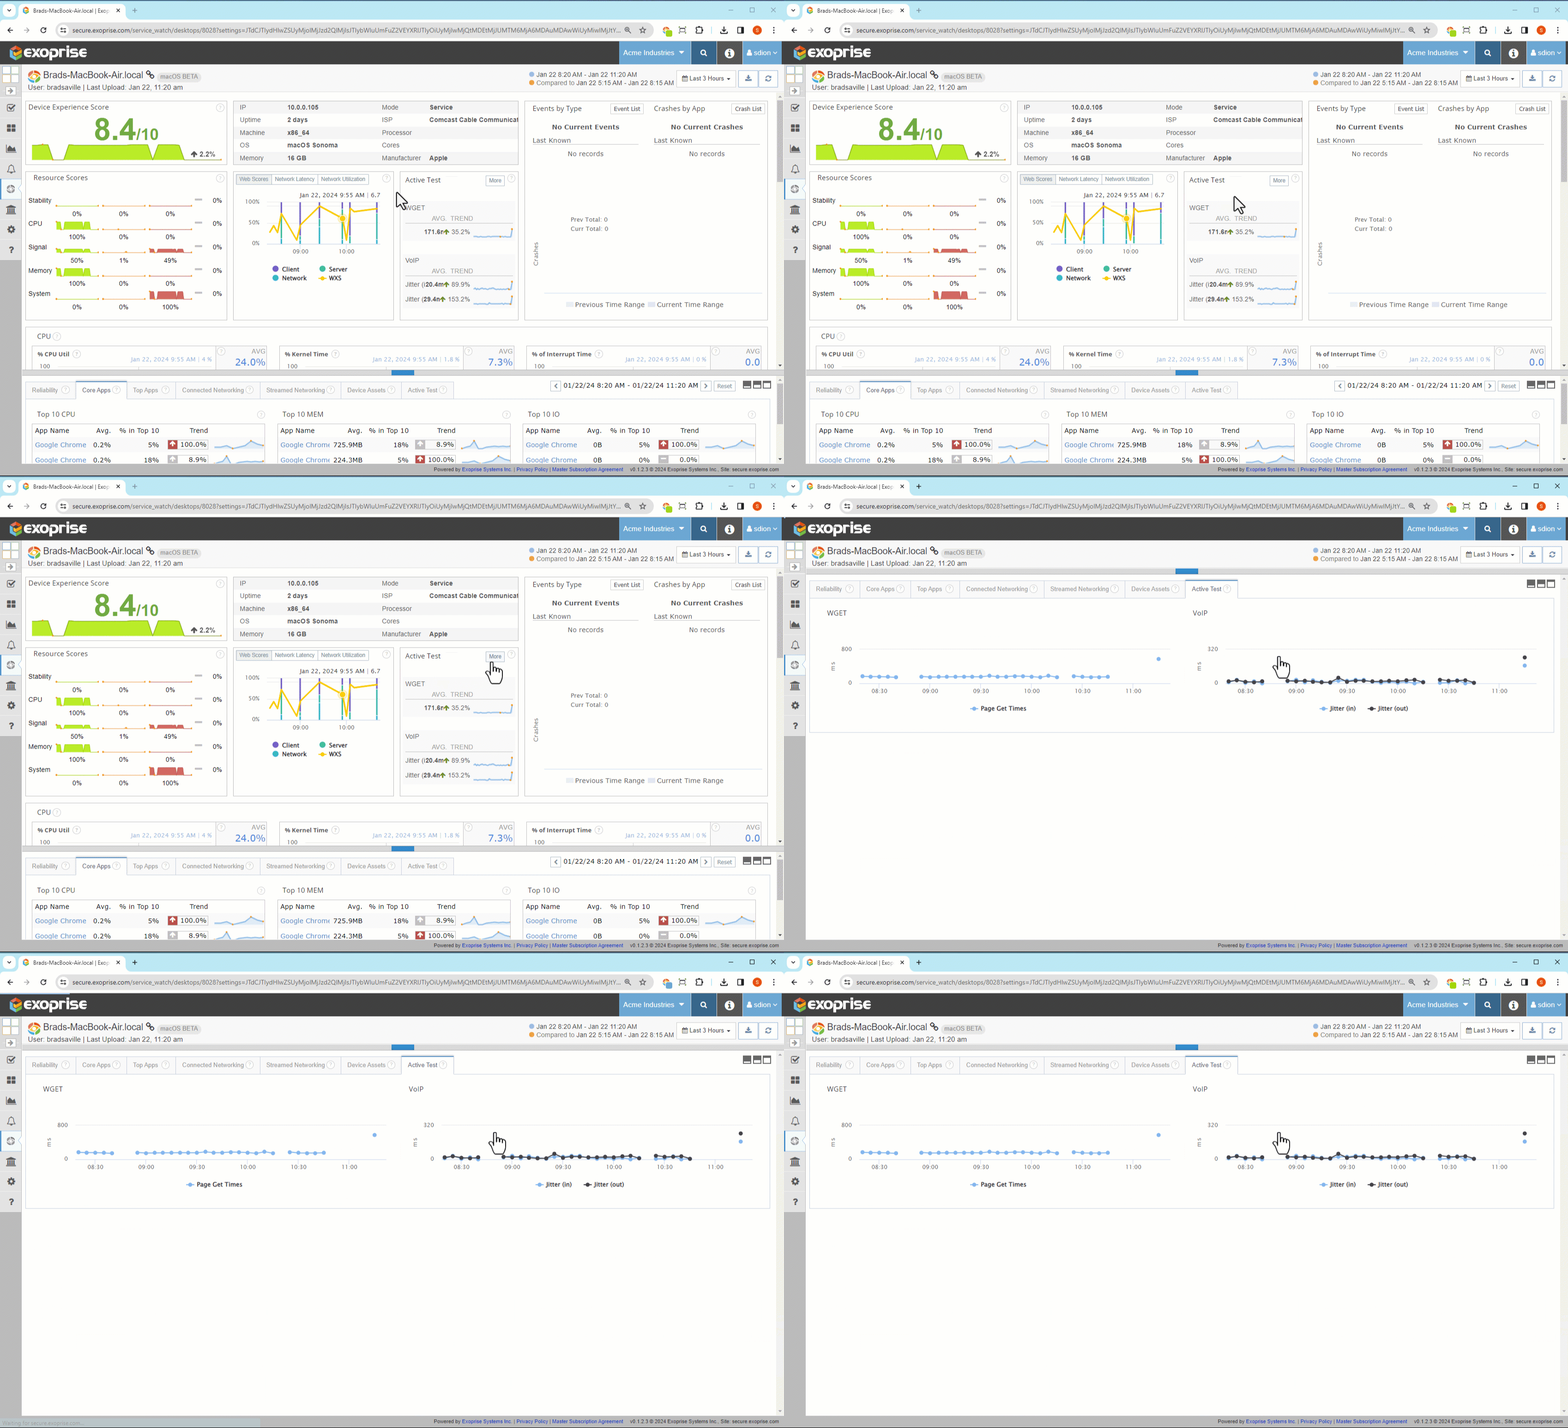
Service Watch Desktop for macOS include Active Test. Active Test is a combination of lightweight synthetics run from an end-users macOS device to generate network performance baselines for comparison. Test the Wi-Fi, network, VPN, VPN and Web performance from an end-users Apple macOS device and utilize simple alarms across groups of devices for proactive detection. Troubleshoot SDWAN, VPNs and other common SASE architectures to ensure they aren’t affecting employee productivity.
Segment and Compare by OS, Network, ISP and more...
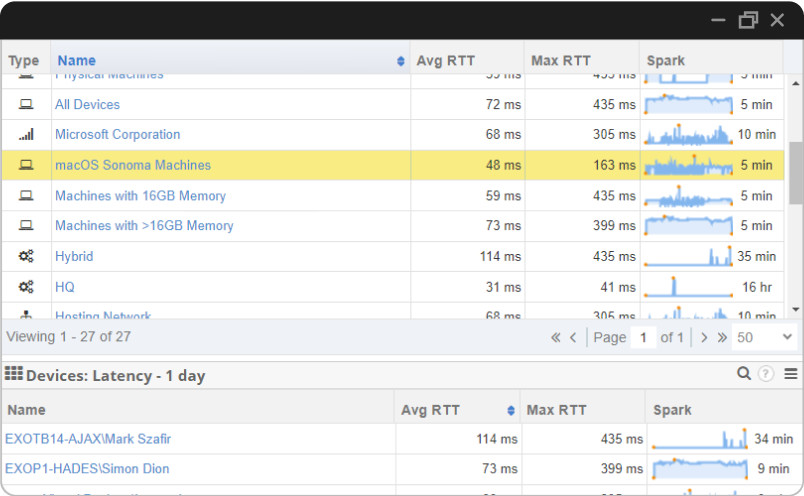
Service Watch Device Groups enable dynamic grouping of devices and metrics for comparison, alarms, and network intelligence. Device Groups can be integrated into any environment and are automatically generated based on device assets.
ISP and network type Device Groups are automatically set up based on heuristics and analysis of each device’s environment. Hybrid employees – work both in the office and at home – are segmented automatically for problem detection.
Give it a try for free.
Diagnose end-user, application, and network issues without complicated deployments
